

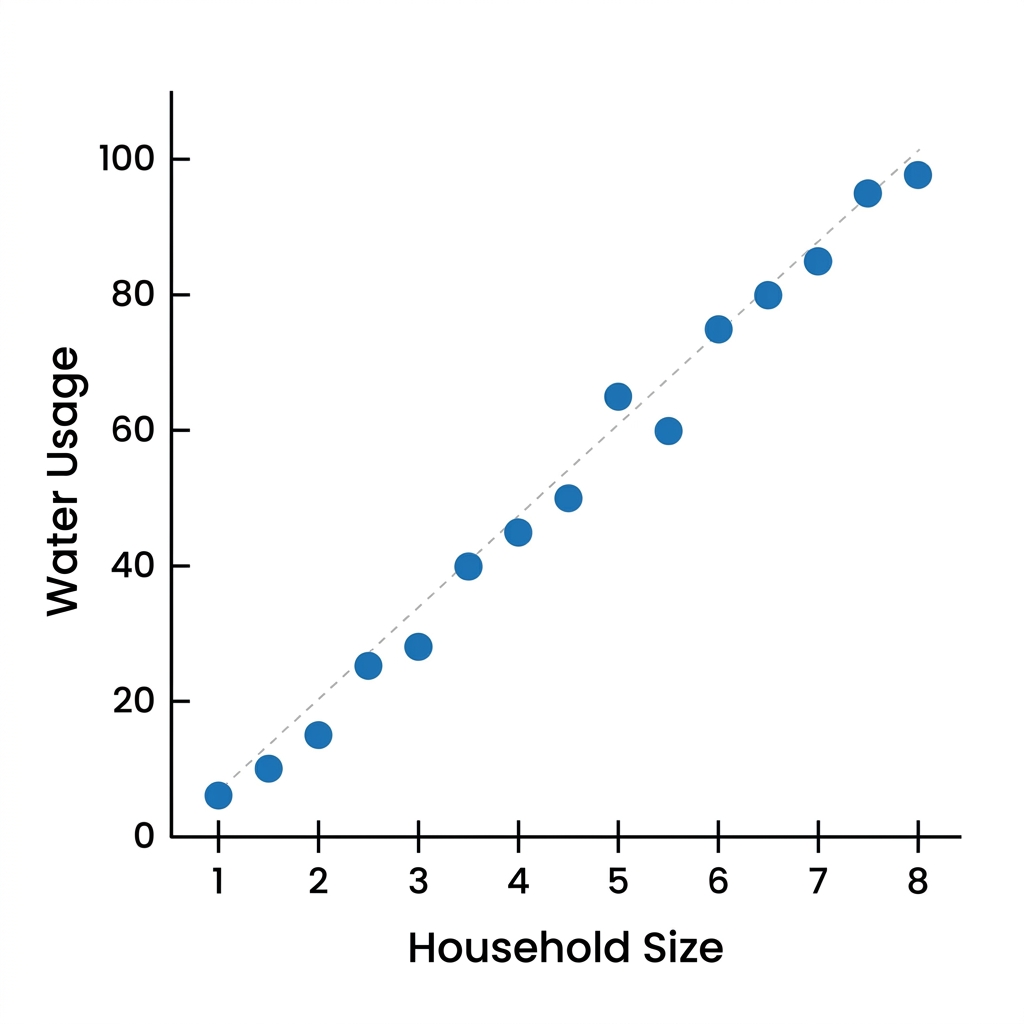
When eighth grade students first encounter scatter plots, they often make the mistake of trying to force a straight line through every single dot. They assume that if the data is not perfectly aligned, it is not useful or simply broken. It is a common hurdle, but it is one that effectively demonstrates why teaching bivariate data needs to start with observation before it moves to calculation. The lesson Understanding Patterns in Data does not try to force students into calculating correlation coefficients or complex regression lines right away. Instead, it slows the process down to focus on the visual interpretation of clusters, outliers, and the general direction of an association.
This 8th grade mathematics lesson covers the foundational concepts of bivariate measurement data. By the end of the forty-five-minute session, students can identify if an association is positive, negative, linear, or nonlinear. They also gain practice in recognizing when a single point sits far away from the rest of the group. This helps them understand that real-world data is rarely perfect. The lesson uses specific, relatable scenarios to ground these abstract terms in reality. For instance, it introduces the concept of an association as a relationship where a change in one variable is linked to a change in another. It defines a scatter plot as a graph that uses dots to represent the values of two different numerical variables for a set of data, and an outlier as a data point that is far away from the rest of the points in a data set.
The material addresses CA.MATH.8.SP.1, which is the California-adopted standard asking students to construct and interpret scatter plots to investigate patterns of association between two quantities. This same standard, which also appears as CCSS.MATH.8.SP.A.1, is taught across the state in districts including Fontana Unified, Elk Grove Unified, Stanislaus Union Elementary School District, and Fallbrook Union Elementary School District. These standards work together to ensure that students can look beyond the individual data points to see the story the numbers are telling about a specific population or event.
How the Lesson Breaks Down Scatter Plots
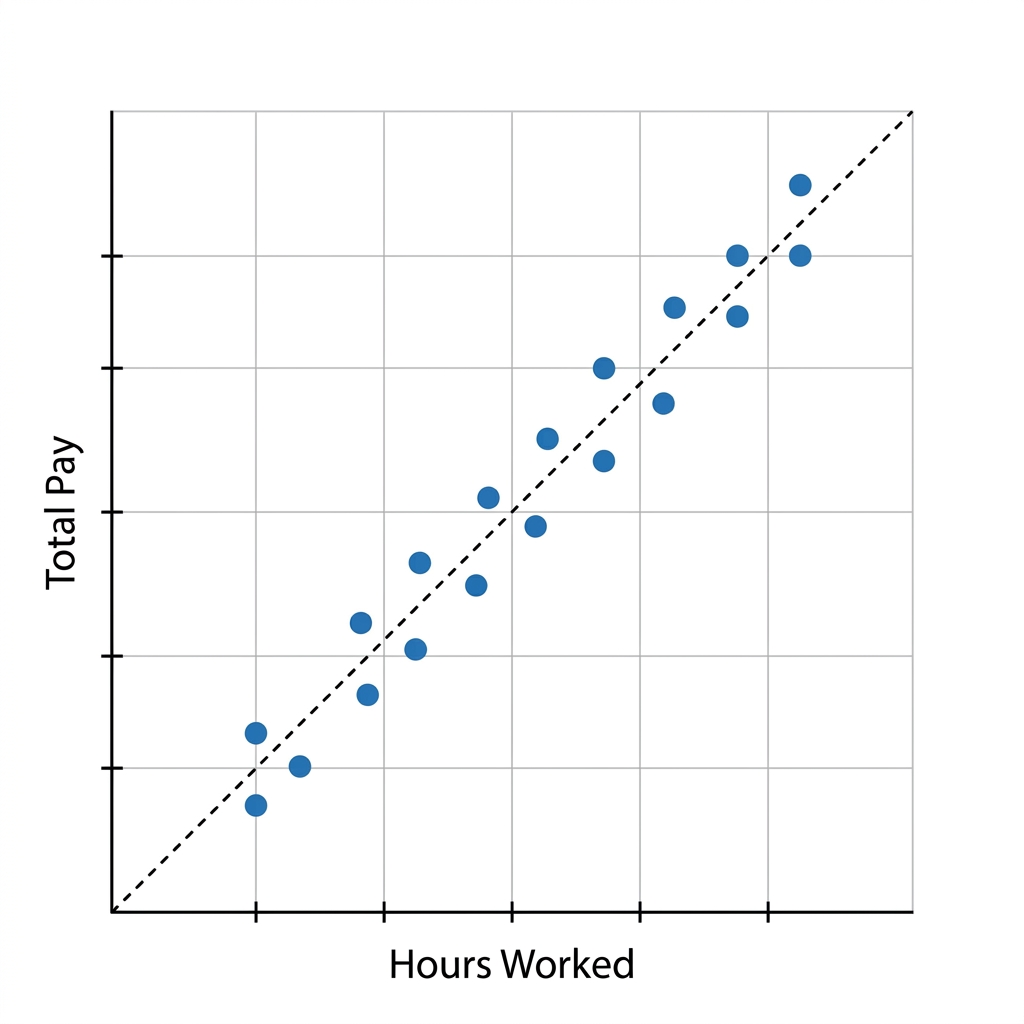
The lesson starts by connecting to prior knowledge. Students already know how to plot points on a coordinate plane, and the lesson uses that as a starting point to see how two different variables interact. The Fresno example is particularly helpful here: it tracks how many sunny days occur each month versus the amount of solar energy produced. By putting these values into a scatter plot, students can clearly see if more sun leads to more energy. The worked example involving Los Angeles water usage versus household size is another strong addition. It shows a linear association where, as the number of people in a house increases, the water usage also increases. This gives students a clear, concrete example of a positive linear association without the noise of outliers.
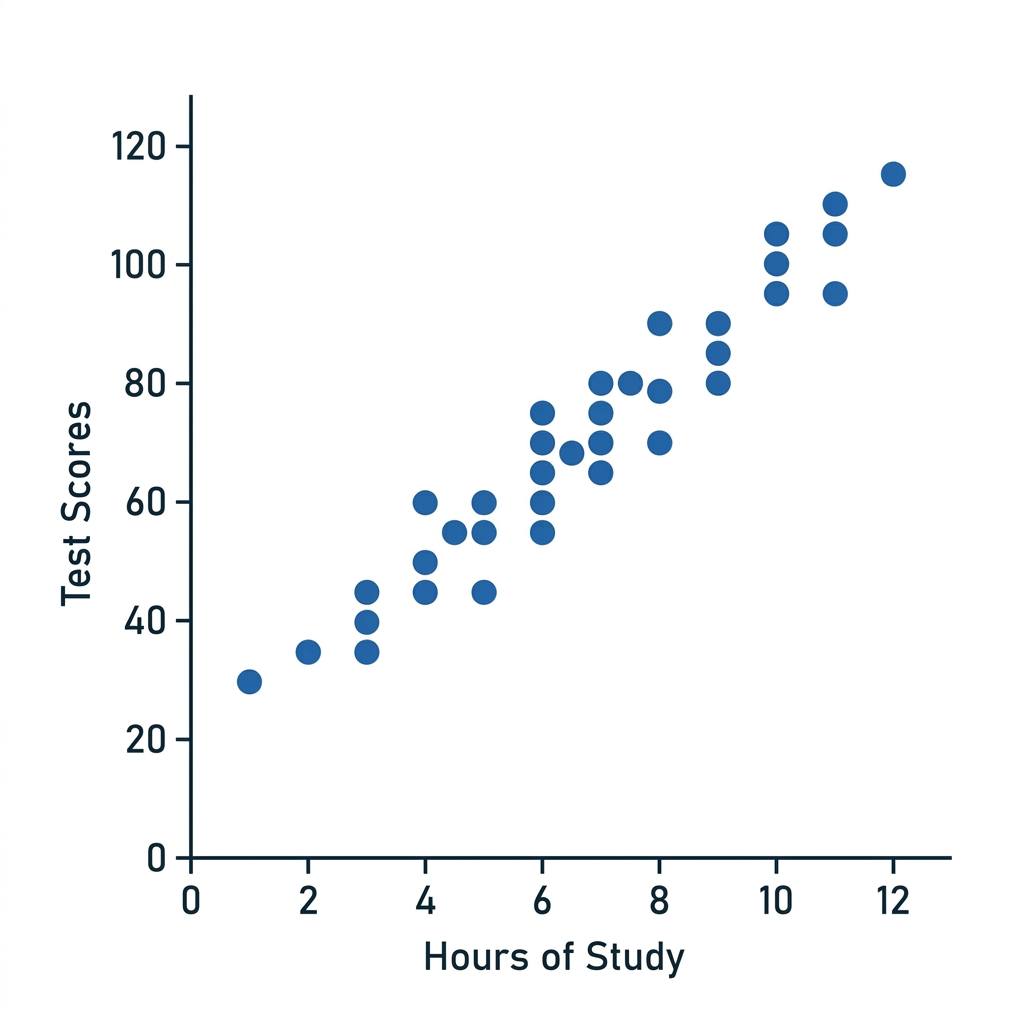
I find the guided practice on commute times in San Francisco to be the best part of the experience. It forces students to take what they just learned and apply it to a new scenario. The lesson designers also include a section on why this matters, using an example of urban planners in Sacramento who use this kind of data to predict traffic patterns. By knowing how population growth relates to traffic, they can build better roads and public transit systems. This provides the kind of context that makes a lesson stick for students who otherwise might see statistics as just another set of calculations to complete on a page.
Using the Lesson in Your Classroom
One caveat I have for any teacher using this material is that students will occasionally get hung up on the difference between a weak association and no association at all. They often want to see a clear line everywhere, even when the data is loosely clustered. It is worth taking a few extra minutes to talk through the clusters and why some points naturally drift away. This lesson is a great candidate for a whole-class assignment when you are introducing the unit, but it is also a perfect fit for a student who missed the week and needs to catch up. It is self-contained and clear enough that it works well for independent study as well.
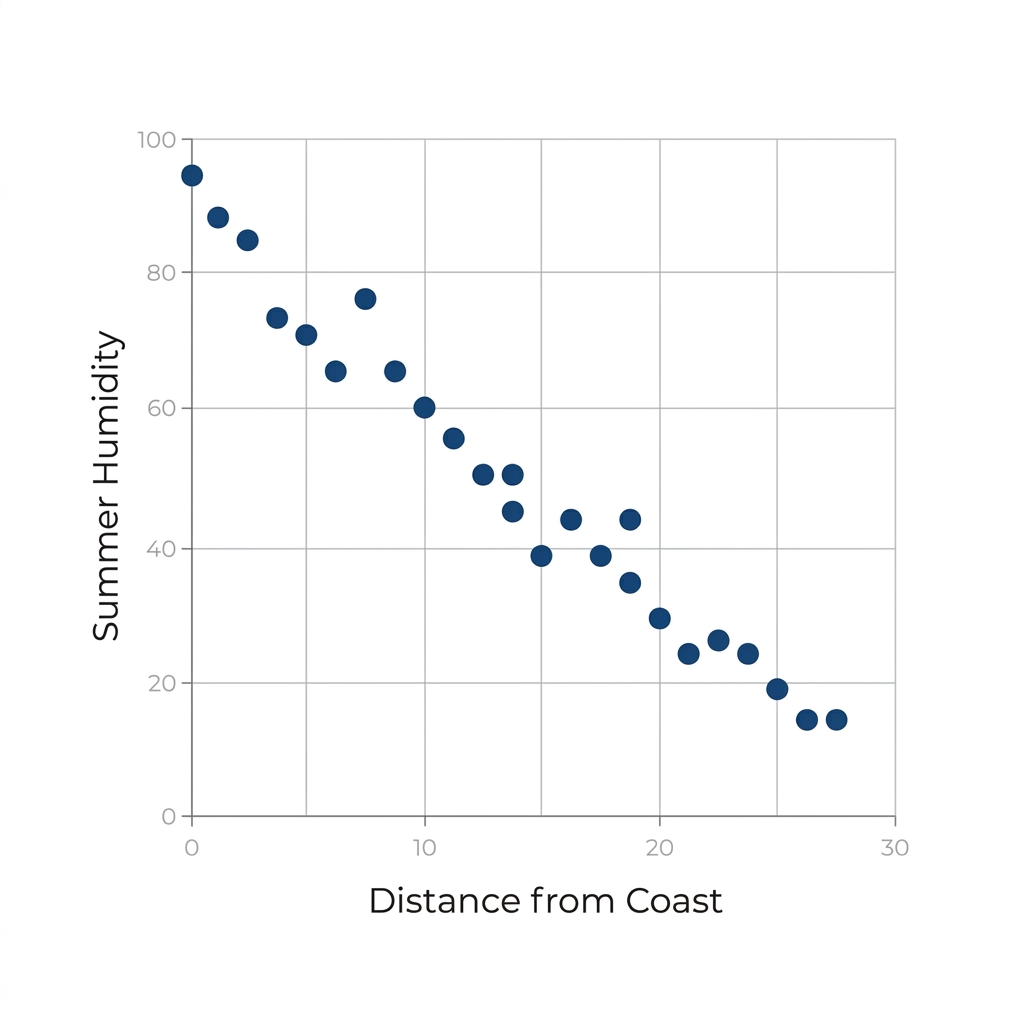
If you have a student who is struggling to see the forest for the trees, these specific examples will give them a path forward. The lesson avoids the trap of using overly abstract numbers, opting instead for local California contexts that make the math feel like it belongs to their own environment. It provides a solid, steady walk through the standards rather than trying to rush to advanced calculations before students have mastered the act of looking at the graph and describing what they see.
Related lessons
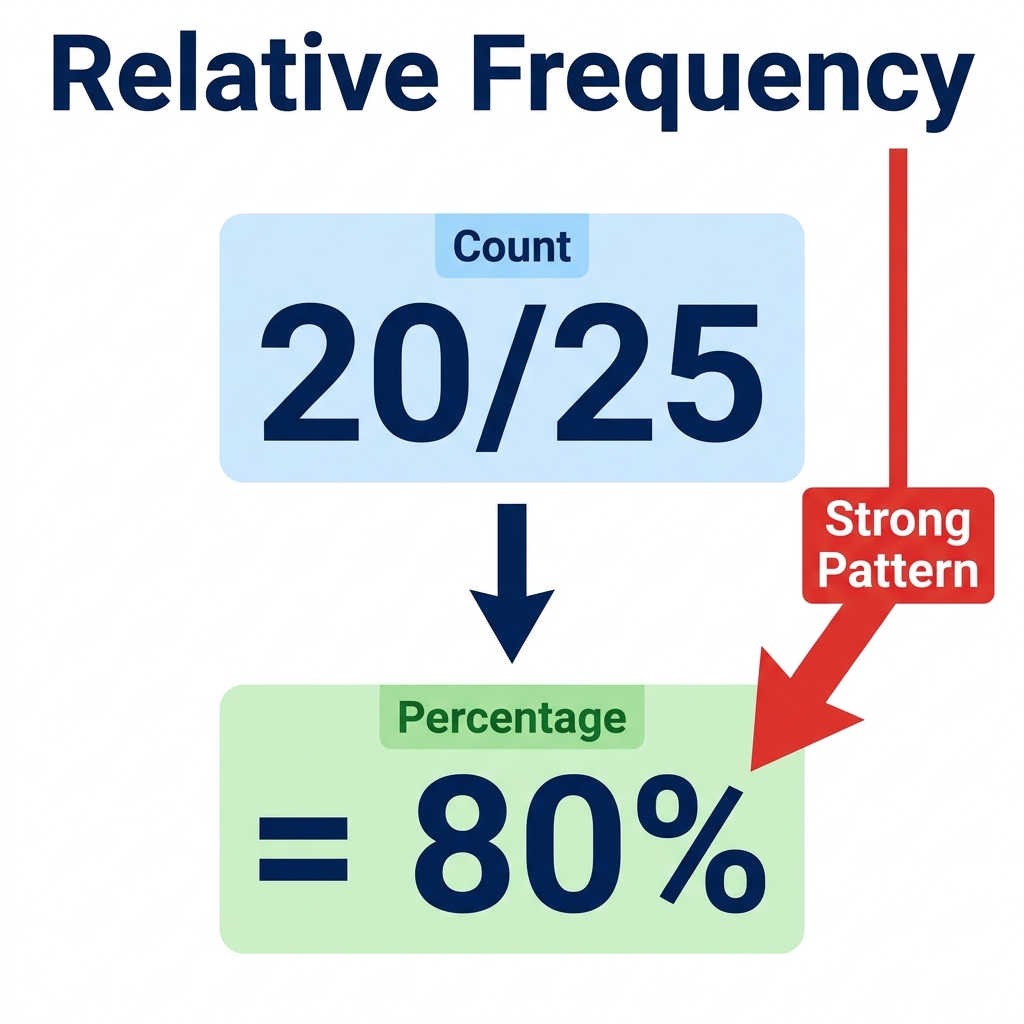
Analyzing Patterns in Two-Way Tables, interpreting data within categorized tables
Evaluating Data Claims, determining validity of presented arguments
Modeling Relationships with Lines, fitting linear equations to plotted points