

Ratios serve as a building block for 6th grade math students, providing the logic needed to understand proportional relationships. By connecting simple numerical comparisons to visual representations on a coordinate plane, students develop a more complete understanding of how variables change together. This lesson resource helps clarify those connections through structured practice.
What the lesson covers
I have often worked with students who freeze up when they see a table of numbers and a coordinate plane on the same page. They understand the concept of a ratio, but translating that comparison of two quantities into a plotted point on a graph is a bridge they have not quite crossed. The Understanding Ratios and Graphs lesson targets this exact hurdle for 6th grade math students. It breaks down the shift from simple comparison to proportional reasoning using visual aids like tiles and practical scenarios like monthly subscription costs.
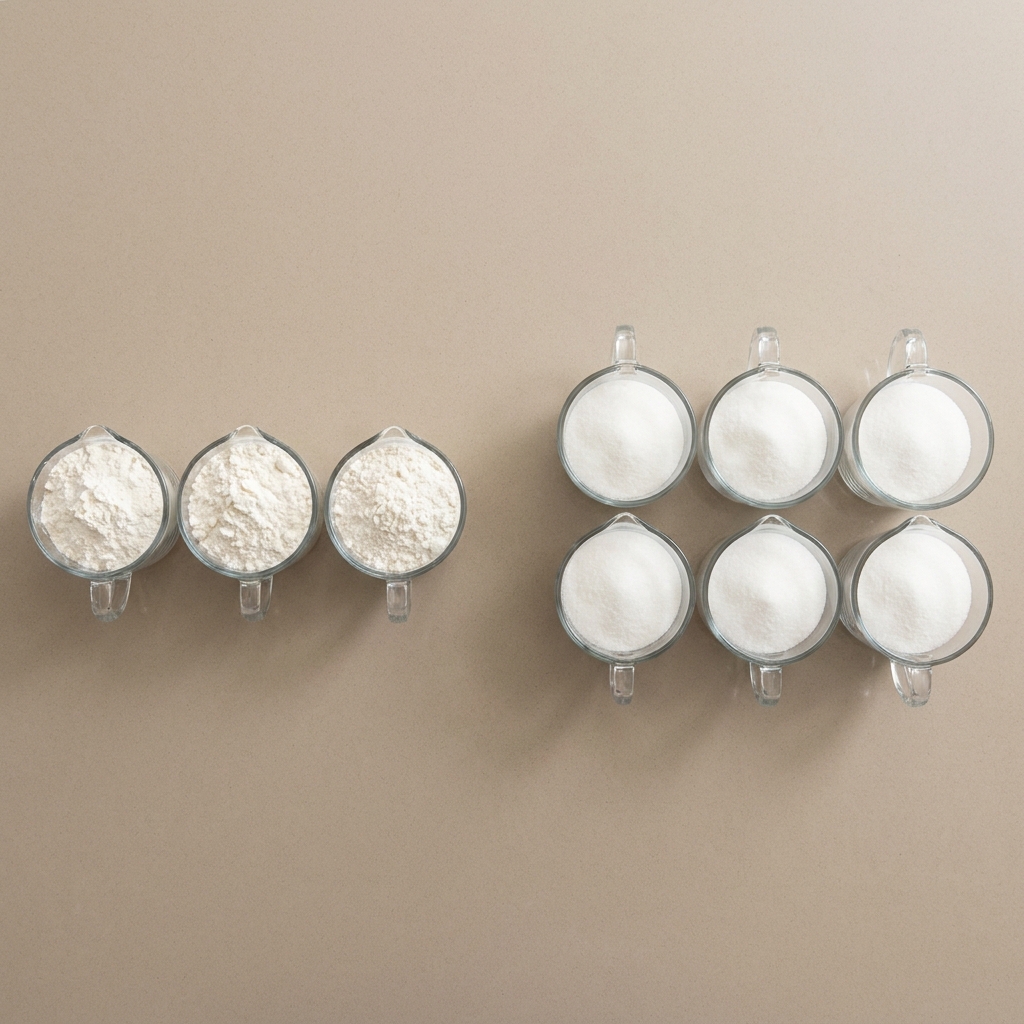
The lesson defines a ratio as a comparison of two quantities showing how many times one is used compared to another. It then moves into equivalent ratios, which are simply ratios that express the same relationship between two quantities. This is the foundation for everything that follows. Students practice scaling patterns by doubling or tripling both parts of a ratio to see how the relationship remains constant. For instance, the lesson uses a pattern of two blue tiles for every three red tiles. By doubling the count to four blue and six red, students see that the ratio of 4 to 6 is equivalent to the ratio of 2 to 3. This approach is concrete and avoids the abstract confusion that often hits students when they only see numbers without a visual pattern to back them up.
Educators in districts like Elk Grove Unified, Oakland Unified, Paradise Unified, and Berkeley Unified share the same instructional requirements for teaching these concepts across the state. This lesson provides a direct way to meet those needs without requiring hours of prep time.
The math standards for 6th grade
This lesson is built to address CA.MATH.6.RP.3a. This California-adopted standard asks that students use ratio and rate reasoning to solve real-world and mathematical problems. The standard expects students to use tables, tape diagrams, double number line diagrams, or equations to make sense of these relationships. It specifically requires students to build tables of equivalent ratios with whole number measurements, find any missing values within those tables, and then plot those pairs on a coordinate plane.
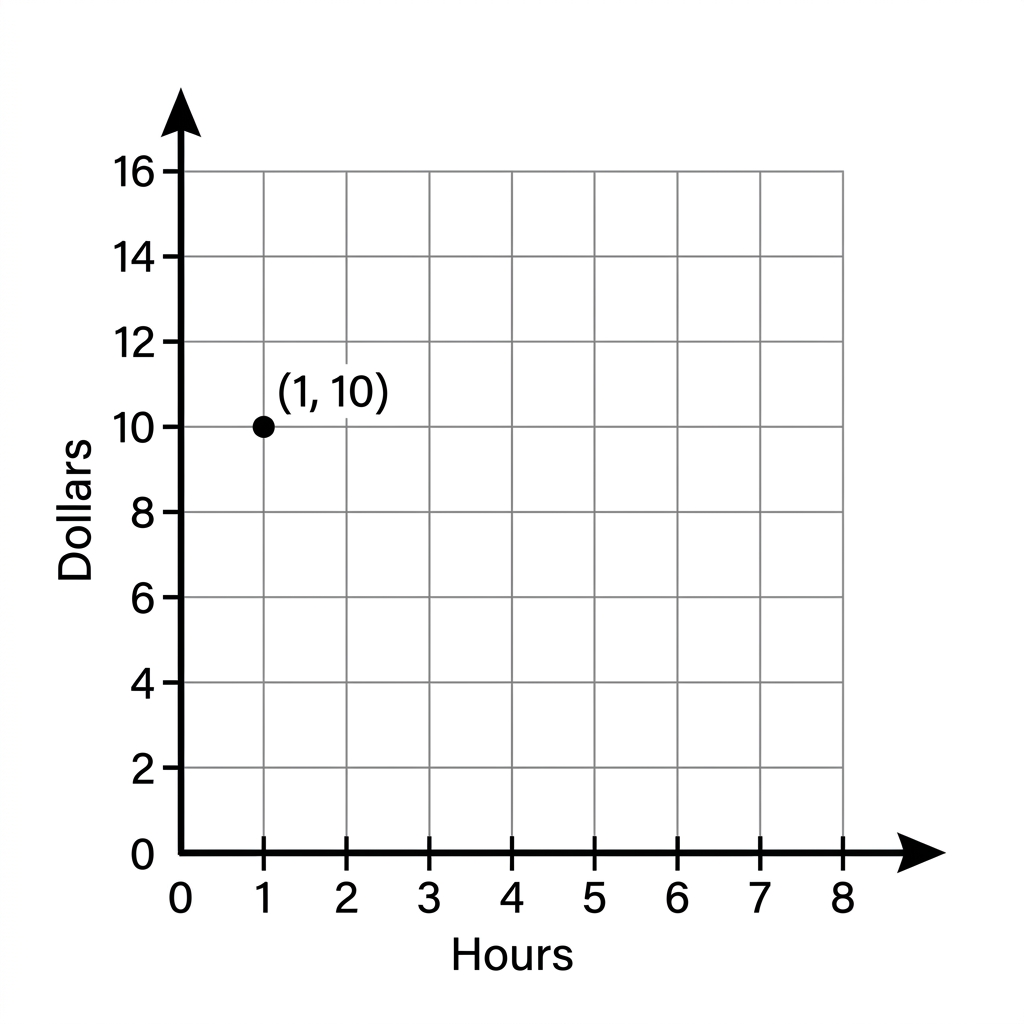
The coordinate plane is defined here as a flat surface formed by two number lines crossing at a right angle, which provides a tool to show pairs of numbers. When a student plots these points, they are visualizing the constant rate of change. It is one thing to see the numbers in a table, but seeing the points line up on a grid helps them grasp that the ratio is not just a collection of random pairs. It is a predictable, proportional relationship. This standard is fundamental for later algebra work, so getting it right in 6th grade saves a lot of headaches in middle school and high school.
How to use this in your classroom
Because this lesson is self-contained and typically lasts about 45 minutes, it is a perfect fit for a few different classroom scenarios. If you are an intervention teacher or an independent-study coordinator, you want materials that are ready to go for a student who missed the week or needs a quick review. This lesson allows those students to work through the logic of 6th grade shared research writing lesson (or more accurately, this 6th grade equivalent ratios lesson) at their own pace.
It also functions well as an attendance recovery assignment. If a student has been absent, they can walk through the worked examples and practice problems independently to get back on track with the rest of the class. The guided practice, which asks students to solve a problem involving a music streaming plan costing 10 dollars for 2 months, is relatable and forces them to apply what they learned about ratios to a real-world scenario. That connection to money and time helps students see why the math matters in their own lives.
Where students slip
The biggest challenge I see with this material is the tendency for students to stop at the table and forget to plot the points. They get comfortable finding the missing value in a table because it feels like a simple pattern, but they sometimes fail to see how that table maps to a coordinate plane. The lesson is designed to force that connection by making the graphing part of the core work rather than an afterthought. If you are assigning this, keep an eye on how they scale the values.
Students often scale one part of the ratio correctly but forget to do the same to the other side. They might see that the price for 2 months is 10 dollars, but then struggle when asked to calculate the price for 4 or 6 months. Remind them that if they do not change both values by the same factor, the ratio is no longer equivalent. It is a common mistake, but it is easy to correct once they see the visual evidence of the graph not forming a straight line. If the points are scattered everywhere on their coordinate plane, they know they have made a calculation error. This immediate feedback is the strongest part of the lesson.
Related lessons
Understanding Ratios – Introduction, Basic overview of comparing two quantities using simple ratios
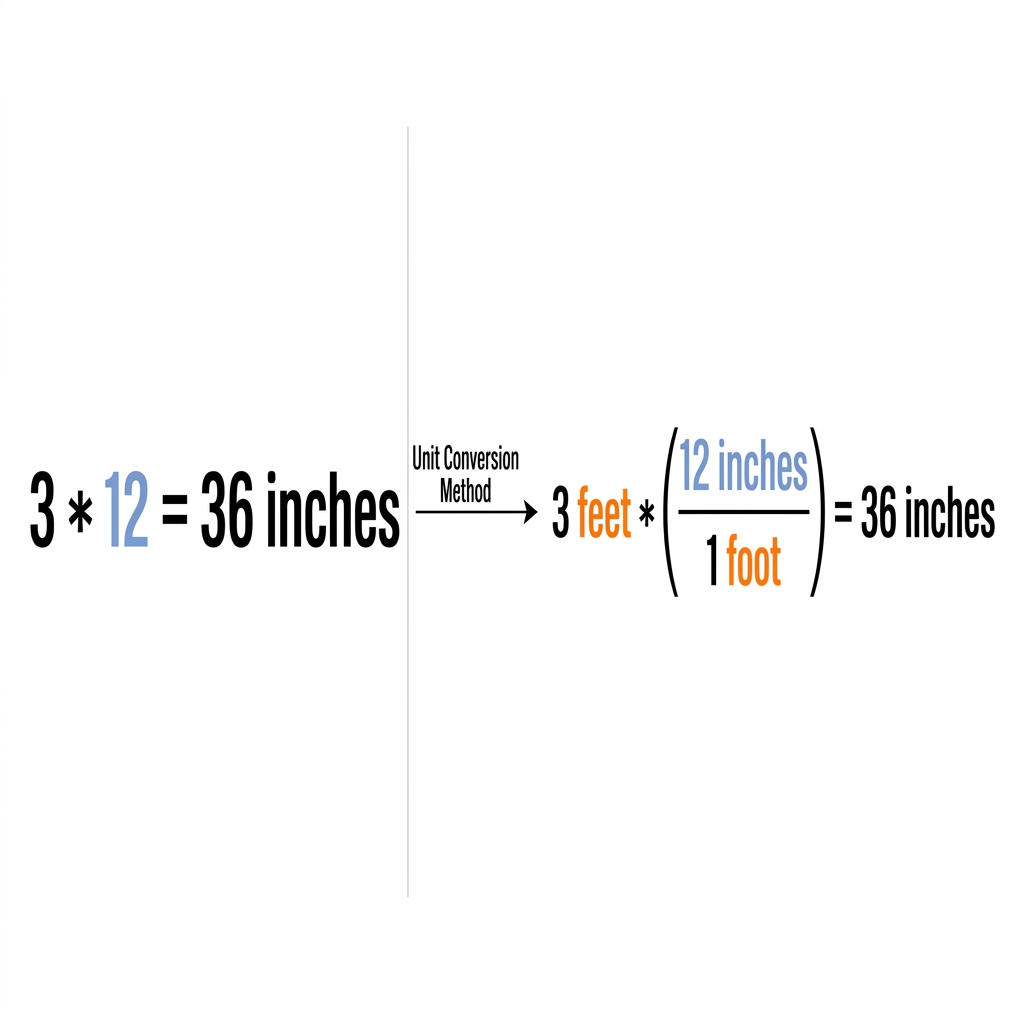
Understanding Ratios and Unit Conversions, Converting units while maintaining equivalent ratio relationships in problems
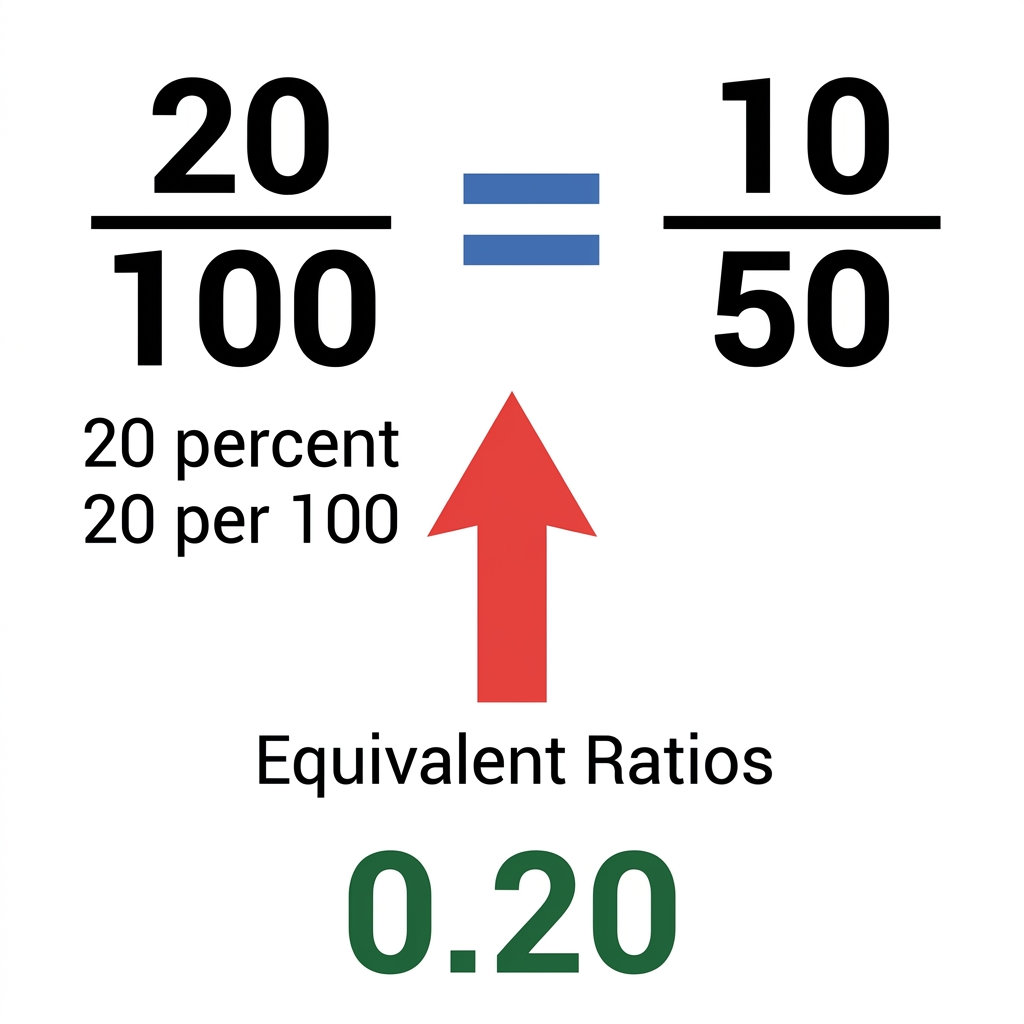
Understanding Ratios, Rates, and Percents, Applying ratio reasoning to rates and percentage based calculations