

When a student stares at a bar graph, they often get stuck on the individual bars rather than the story the bars tell together. They might see a bar that is higher than the rest and shout out the tallest one, ignoring the trend altogether. It is a common moment in 2nd grade computer science instruction. Students want to name the objects they see, but they have not yet built the habit of looking for the movement or the change over time that a graph represents.
This is why Finding Patterns in Data is such a useful tool for your classroom. It focuses on the specific skill of looking at data visualizations to make predictions. By guiding students through basic charts, it moves them past the impulse to just label what they see and gets them toward identifying a mathematical or visual rule. Whether you are working with a student who needs some intervention, assigning an independent study project, or filling in a gap for someone who missed the week, this lesson provides a clear path forward.
What the lesson actually asks students to do
The core of this work is tied to CA.CS.K-2.DA.9. This is the California-adopted standard that asks students to identify and describe patterns in data visualizations, such as charts or graphs, to make predictions. Teachers in Los Angeles Unified, Poway Unified, San Mateo-Foster City School District, and Dublin Unified all use this same standard to build fundamental data literacy in their primary students. It is a vital building block for later computer science work where debugging or predicting system behavior will require this exact same pattern recognition.
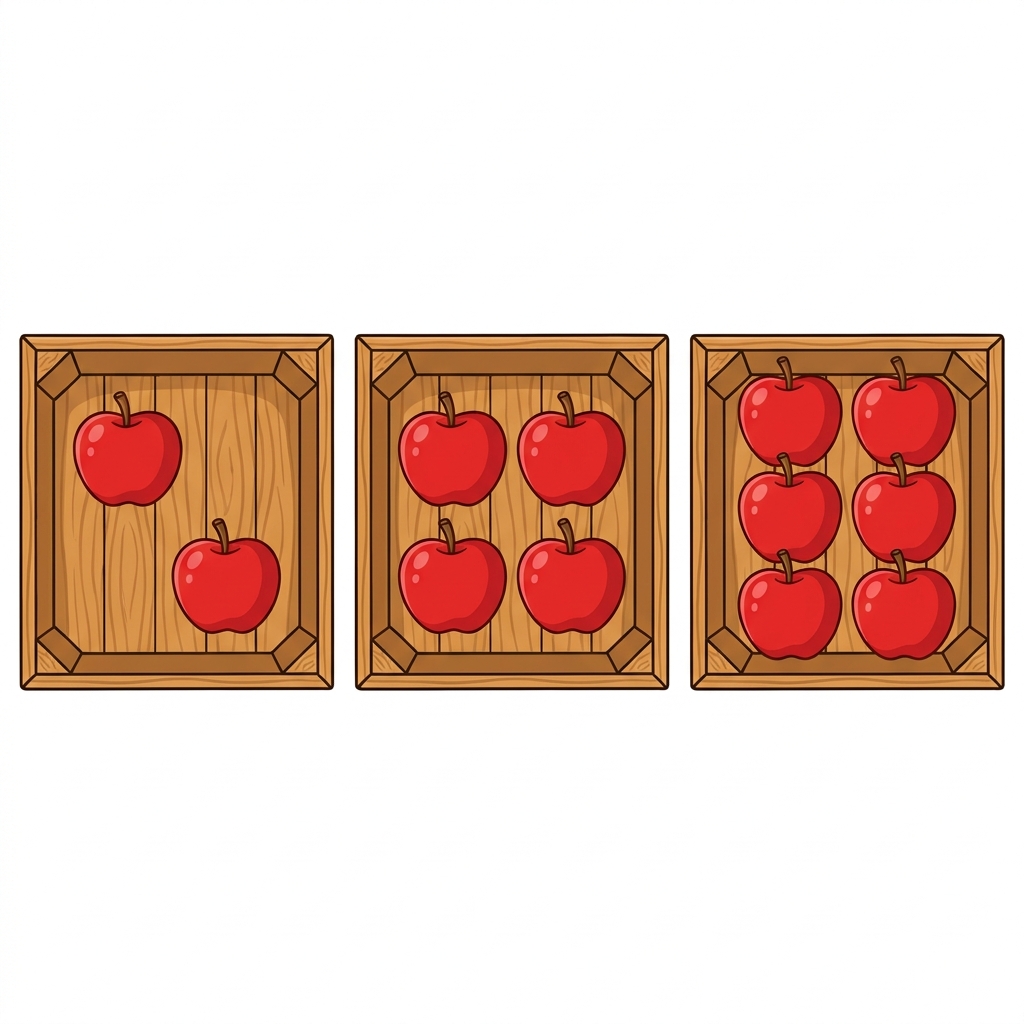
The lesson begins with a simple, relatable example. It introduces the idea that we collect data to see how things change over time, using a classroom tracking system for books read. When the data shows 5 books in January, 10 in February, and 15 in March, the students are pushed to identify the steady growth. The material provides a clear worked example: when fruit sales go from 2 to 4 to 6, the student notices that the amount increases by 2 each time. The lesson explicitly notes that this is a clear pattern because the growth is steady and easy to follow. It demystifies the graph by showing that a bar graph is just a way to represent numbers with varying bar heights.
Where students slip
The trickiest part for young learners is moving from observation to prediction. After the initial examples, the guided practice asks the student to look at a program involving students wearing sneakers versus boots. This is where you will see if the lesson has landed. Some students will still just try to count the boots or sneakers, rather than looking at the relationship between the two categories. If they get stuck, refer them back to the why-it-matters statement in the material: meteorologists use these same patterns to predict the weather, and game designers use them to keep a game fun and challenging. It grounds the abstract numbers in a practical reality that second graders can actually visualize.

You will find this second grade data patterns lesson to be a reliable choice for a substitute day because it does not require complex setup or specialized software knowledge. It keeps the focus on the logic. The vocabulary is minimal, keeping the cognitive load on the data analysis itself rather than decoding complex technical terms. I have found that students often need to see the jump between 5, 10, and 15 written out in numbers below the chart before they truly understand why the bar is getting taller. When they finally grasp that the graph is just a picture of a rule, they stop seeing it as a collection of random boxes and start seeing it as a tool they can actually use to guess the future. That shift is the whole goal of the lesson.
Related lessons

Managing Your Digital Files, Teaches students how to organize and keep digital files tidy
Organizing and Showing Data, Methods for categorizing information and presenting it to an audience