

By the time third graders reach this part of the curriculum, they have usually mastered measuring to the nearest inch. Moving into fractions like halves and fourths of an inch often creates a stumbling block for students who are not quite ready to subdivide that space on a ruler. If you are an intervention teacher or an independent-study coordinator, you know that this specific shift in precision is where many students start to lose their footing. Measuring Lengths and Making Line Plots is a solid, focused resource to use when a student needs a re-introduction to these concepts or a little extra time to practice before the end of the year.
This lesson covers CA.MATH.3.MD.4, which is the California-adopted standard for measurement and data. This standard expects students to generate their own measurement data using rulers marked with half-inch and quarter-inch increments, then represent that data on a line plot where the scale is correctly marked off. You will find that this material is taught consistently across the state, from Santa Ana Unified to Moreno Valley Unified, and into San Marcos Unified and the Roseville City Elementary School District.
What the lesson actually asks students to do
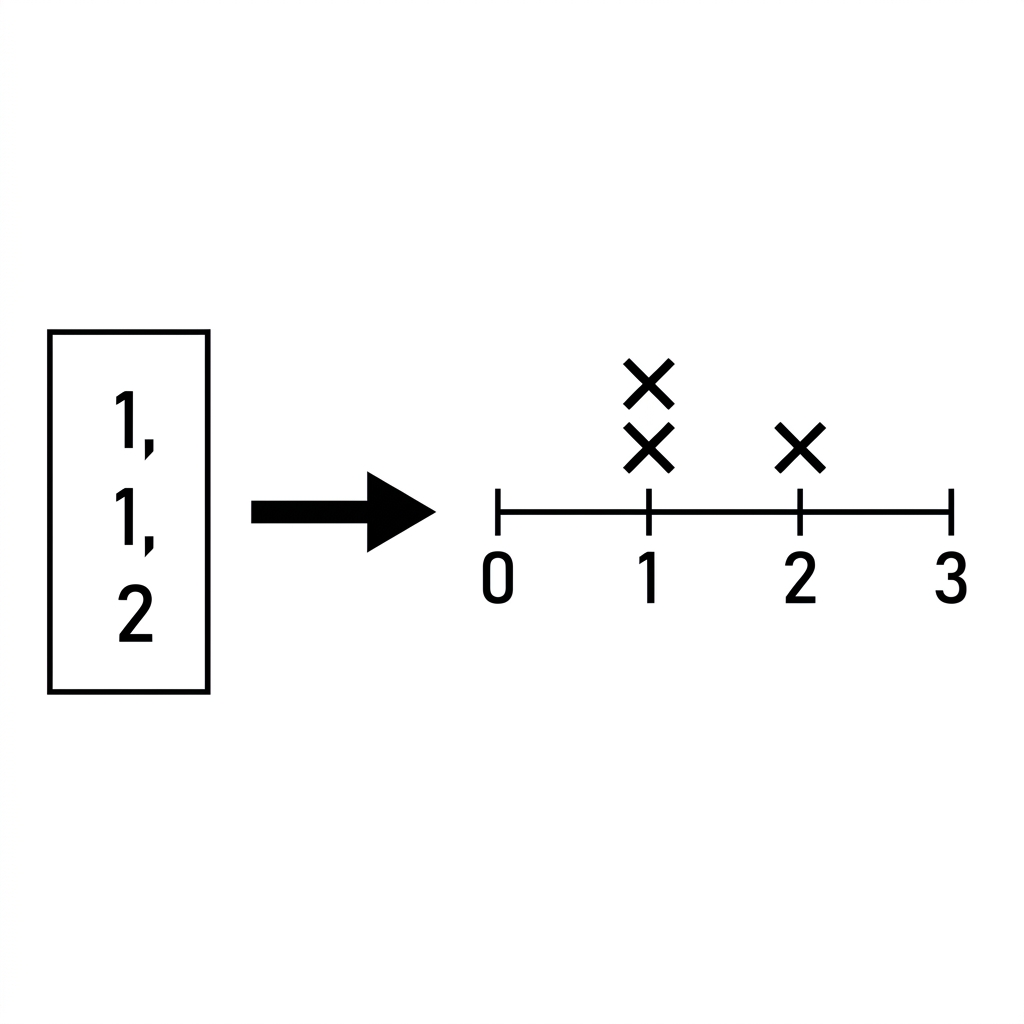
The core objective is to move beyond simple whole numbers. The lesson opens by acknowledging prior knowledge of measuring to the nearest inch, then introduces the more precise quarter-inch increment. Students work through scenarios like measuring leaves to build a dataset. They then learn that a line plot is simply a way to show data by placing marks above a number line to show how many times each length happens. For example, if they measure four leaves and two are one inch long, they place two X marks above the 1 on the number line.
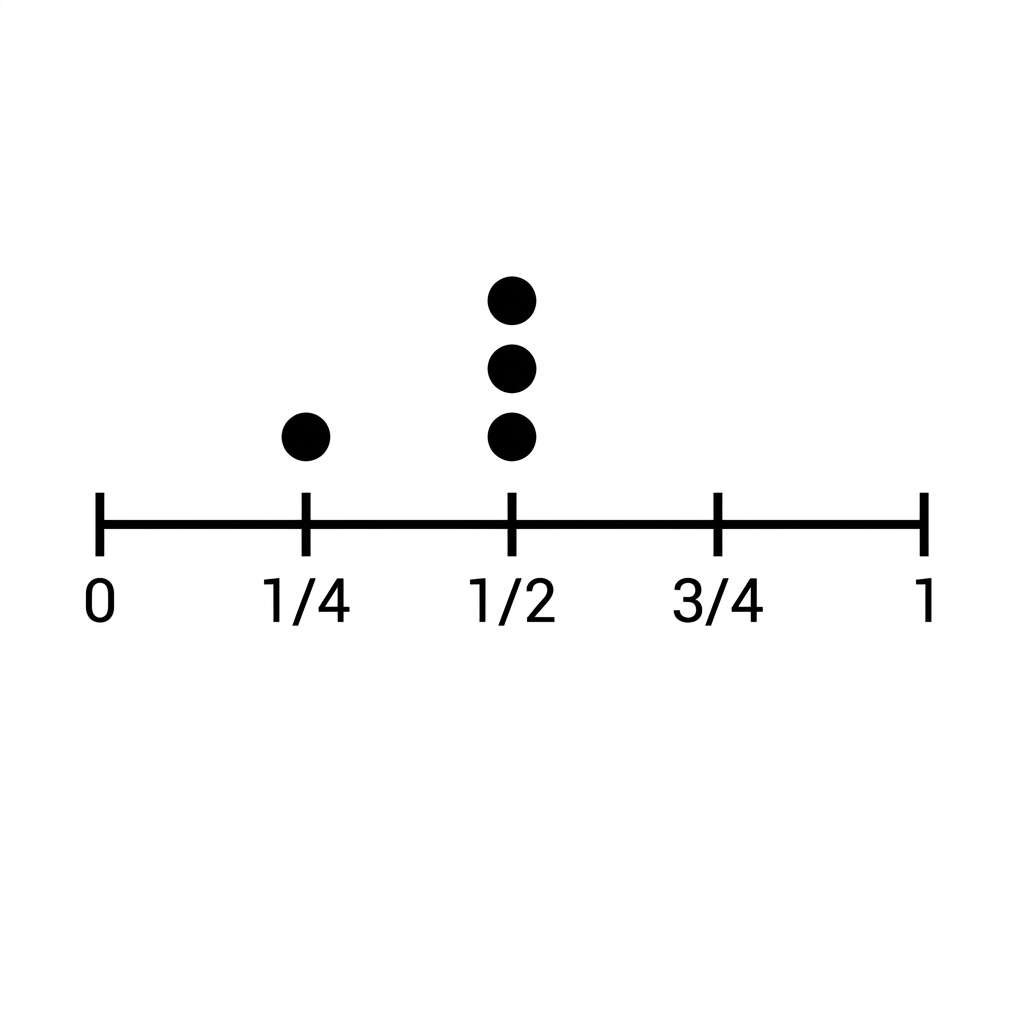
Vocabulary is kept simple so students do not get bogged down. The lesson defines a quarter inch as a unit of length equal to one-fourth of an inch. After the initial examples, students move into a guided practice section about measuring the width of various buttons. It is a straightforward approach that takes about 45 minutes to complete. Because it focuses on the mechanics of measurement, it works well as a third grade measurement data lesson for a student who missed the week or someone working on independent study who needs a quick, effective refresher.
Where students slip
The trickiest part for most students is not the measurement itself, but the transition to the line plot. They often struggle to identify the correct tick marks on a ruler, especially the difference between a half-inch and a quarter-inch. I have found that if a student is rushing, they tend to count the lines on a ruler rather than the spaces, which leads to errors every time. Keep an eye on their initial measurements before they move to the graphing portion of the task. If their data is off, the line plot will look correct based on their numbers but will not accurately reflect the objects being measured.
I recommend this for independent study or as a backup for a substitute day because the steps are logical and follow a clear progression. It provides that real-life context students appreciate, like mentioning how carpenters use these plots to ensure they have enough pieces of wood of the same length to build something like a bookshelf. When students see that the math actually serves a purpose in building things, they tend to take the precision of the ruler more seriously. If you have a student who consistently misses the mark on these measurements, this exercise provides the structure they need to get back on track without needing a full re-teach of the entire unit.
Related lessons
Building Rectangles with Area, Covers how to calculate area by building rectangular shapes
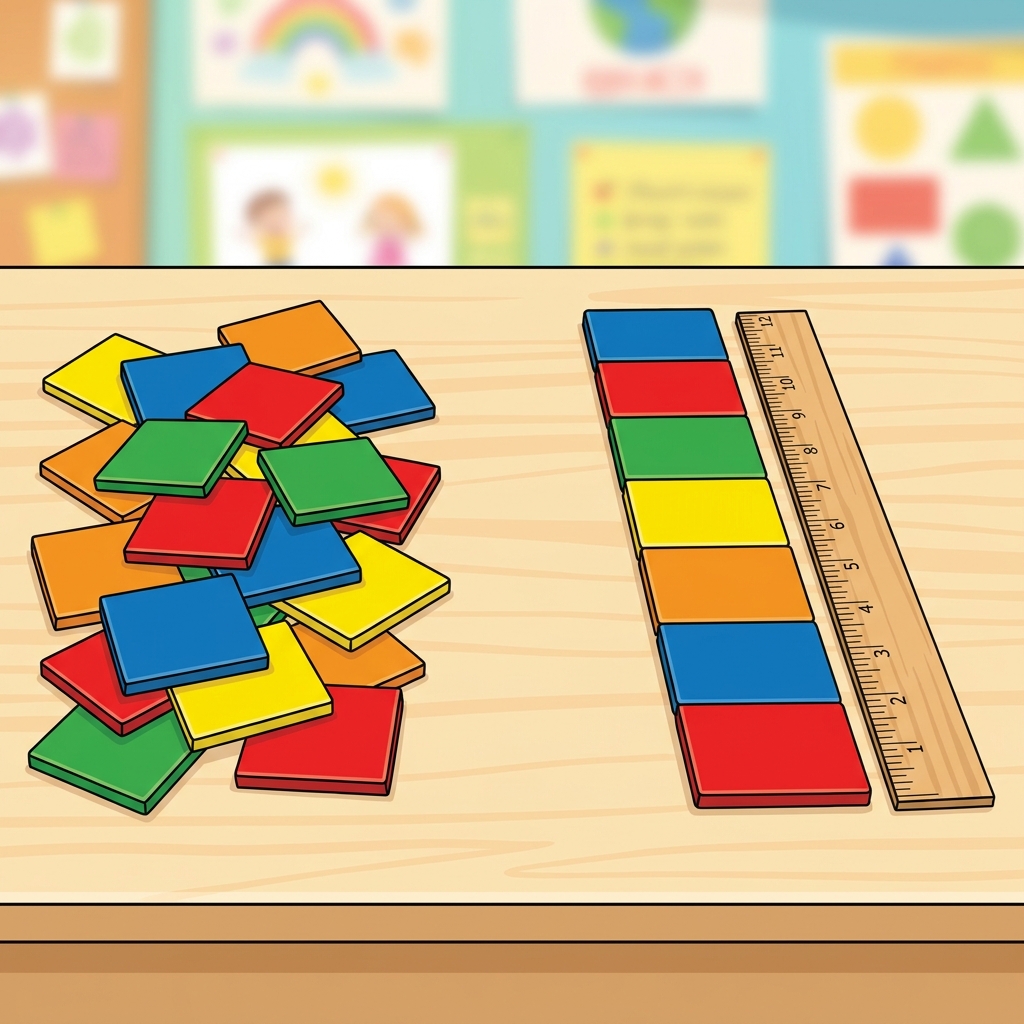
Measuring Space with Squares, Introduces measuring space using square unit blocks
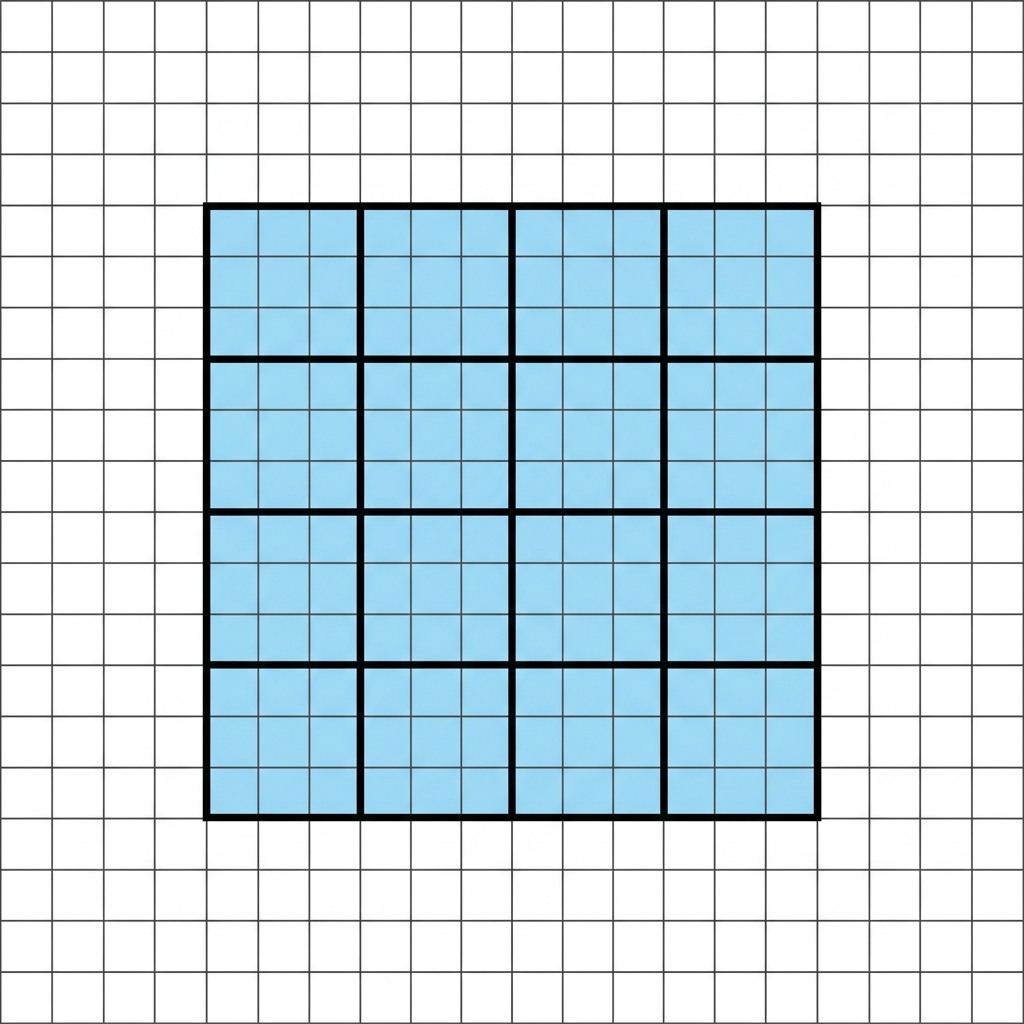
Measuring Space with Squares, Introduces measuring space using square unit blocks