

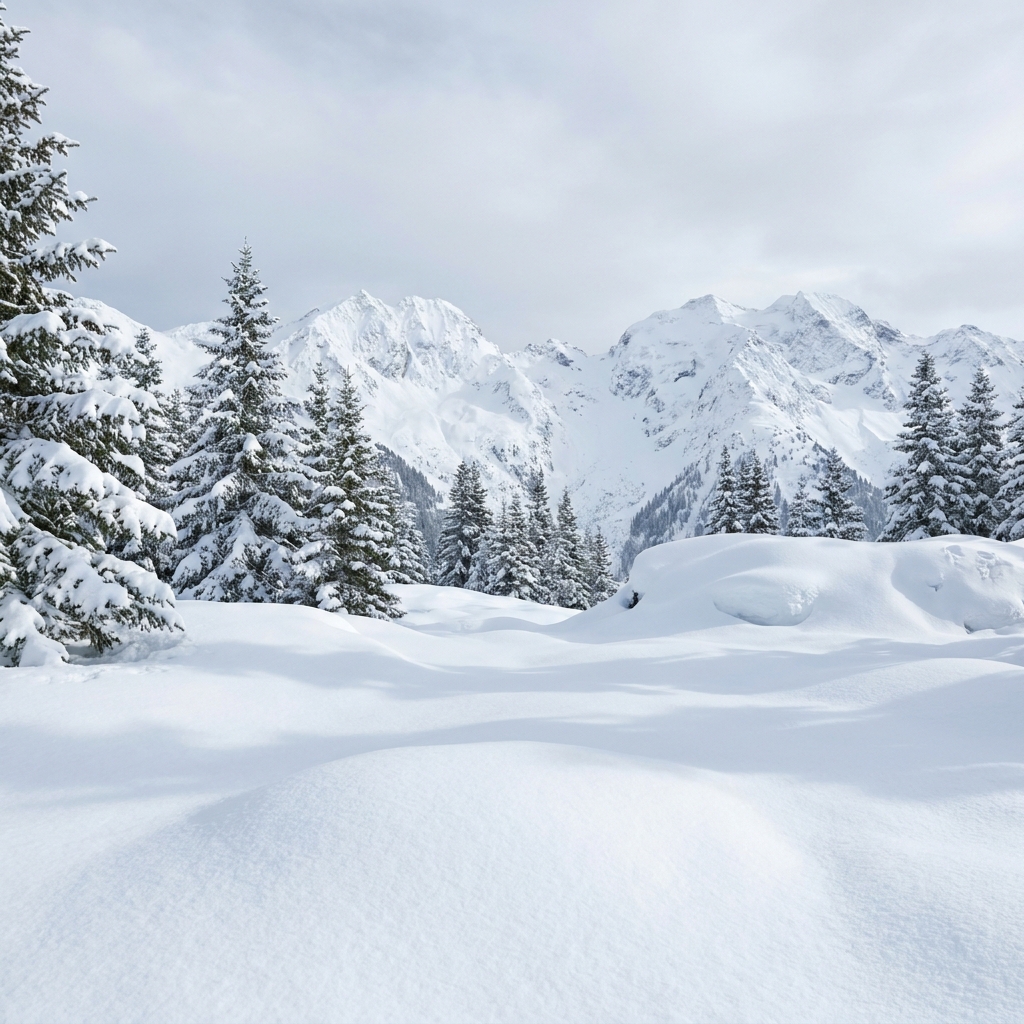
Third grade is a sweet spot for starting more rigorous data analysis in science. When the seasons shift from fall to winter or spring to summer, your students are already noticing the changes in temperature and rainfall. That is the perfect time to pull up Weather Patterns in California. This 3rd grade science lesson leans heavily into the observation skills kids have been building for years but adds the necessary layer of structured data analysis.
I find that my students often have a loose sense of weather but struggle to quantify it. They know it rains, but they have not always looked at a graph to see how much rain falls month by month. This lesson does exactly that by using tables and graphs to move from vague ideas about weather to specific, descriptive patterns.
What the standard actually asks
This lesson is built to support the California-adopted standard 3-ESS2-1. This standard asks students to represent data in tables and graphical displays to describe typical weather conditions expected during a particular season. It is a specific goal shared by schools across the state, from Los Angeles Unified and Santa Ana Unified to Konocti Unified and Oakley Union Elementary School District.
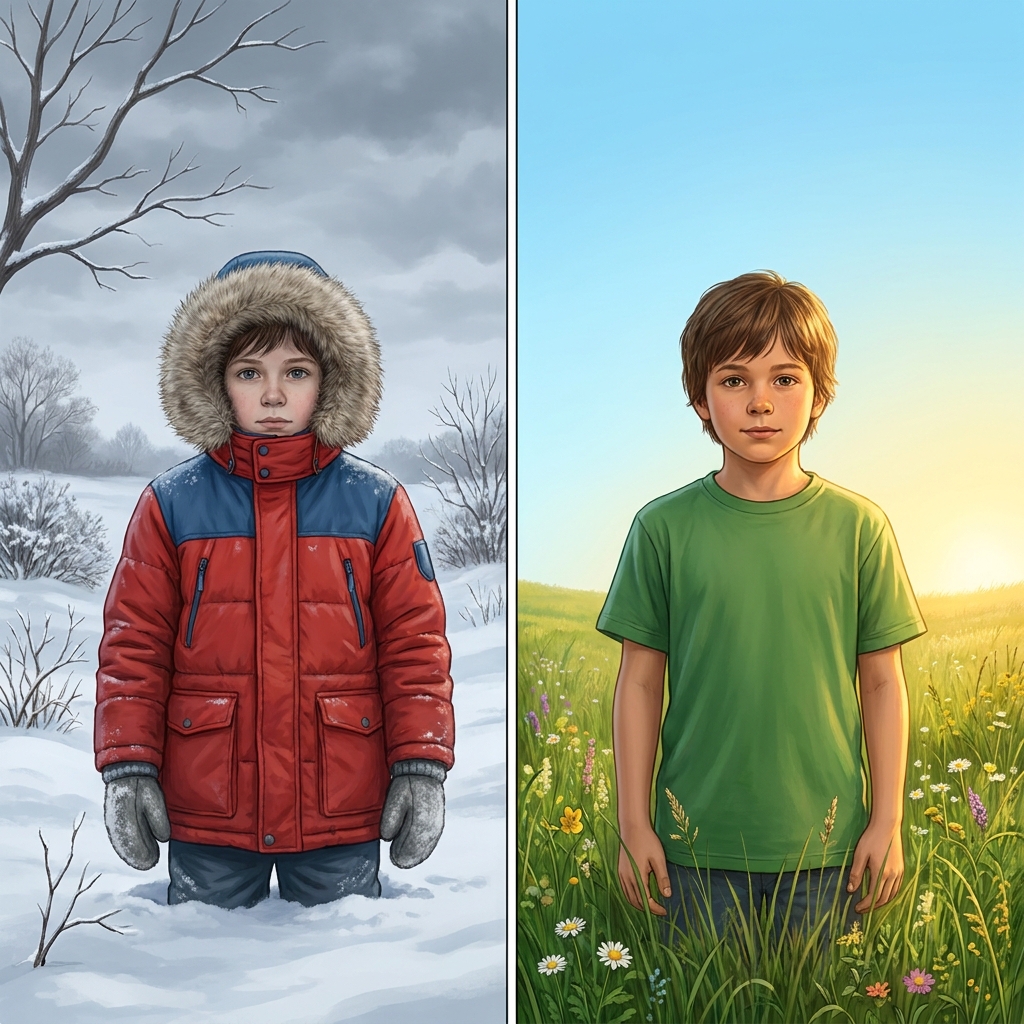
The lesson does not just stick to generic charts. It specifically includes data from California climate zones such as coastal, inland valley, desert, and mountain regions to illustrate seasonal weather variation. This is important because it connects the abstract skill of graphing to the local geography your students actually walk through every day. If you are teaching in an inland valley, they can see exactly how the data matches their own experience of hot, dry summers.
Breaking down the vocabulary
Before the students start graphing, the lesson introduces three terms that anchor the scientific thinking. Keeping these clear helps the whole class move in the same direction:
Climate Zone: A region that has its own typical weather patterns, like how much rain falls or how hot it gets, over a long period of time.
Precipitation: Any form of water, such as rain or snow, that falls from the sky to the ground.
Seasonal Variation: The way weather changes in a predictable pattern throughout the different times of the year.
I have found that focusing on seasonal variation is where the lightbulb usually turns on for students. Once they look at a mountain region table and see the heavy snowfall occurring in the same winter months year after year, the concept of a predictable pattern becomes concrete. They stop seeing weather as random and start seeing it as a cycle that can be mapped.
Practical application and student practice
The lesson moves from concept to practice by giving students data cards to analyze. They have to look at the snowfall totals for a mountain region and use those numbers to explain the winter season. It is a clean, straightforward way to practice a third grade science weather data lesson that avoids over-complicating the math.

The real-world application here is quite clever. The lesson explains that farmers use this information to decide when to plant their crops. If they know the climate zone is usually dry in summer, they know they need to water their plants. When you connect data to survival and food, the students tend to pay much more attention. It makes the act of plotting points on a graph feel like a purposeful task rather than just busy work.
If you are looking for a way to fill a substitute day, this is a solid choice. It provides enough structure that students can work independently, but the content is rich enough that they are actually learning a standard. It also functions as a great intervention tool for a student who missed the week of instruction and needs to catch up on the basics of data representation without needing to sit through an entire lecture.
My only caveat is that some students might get stuck if they are not yet comfortable reading a table. You might need to spend a minute or two modeling how to cross-reference the month with the snowfall column before letting them run with it. Once they see the connection, they usually do not need much more hand-holding.
Related lessons
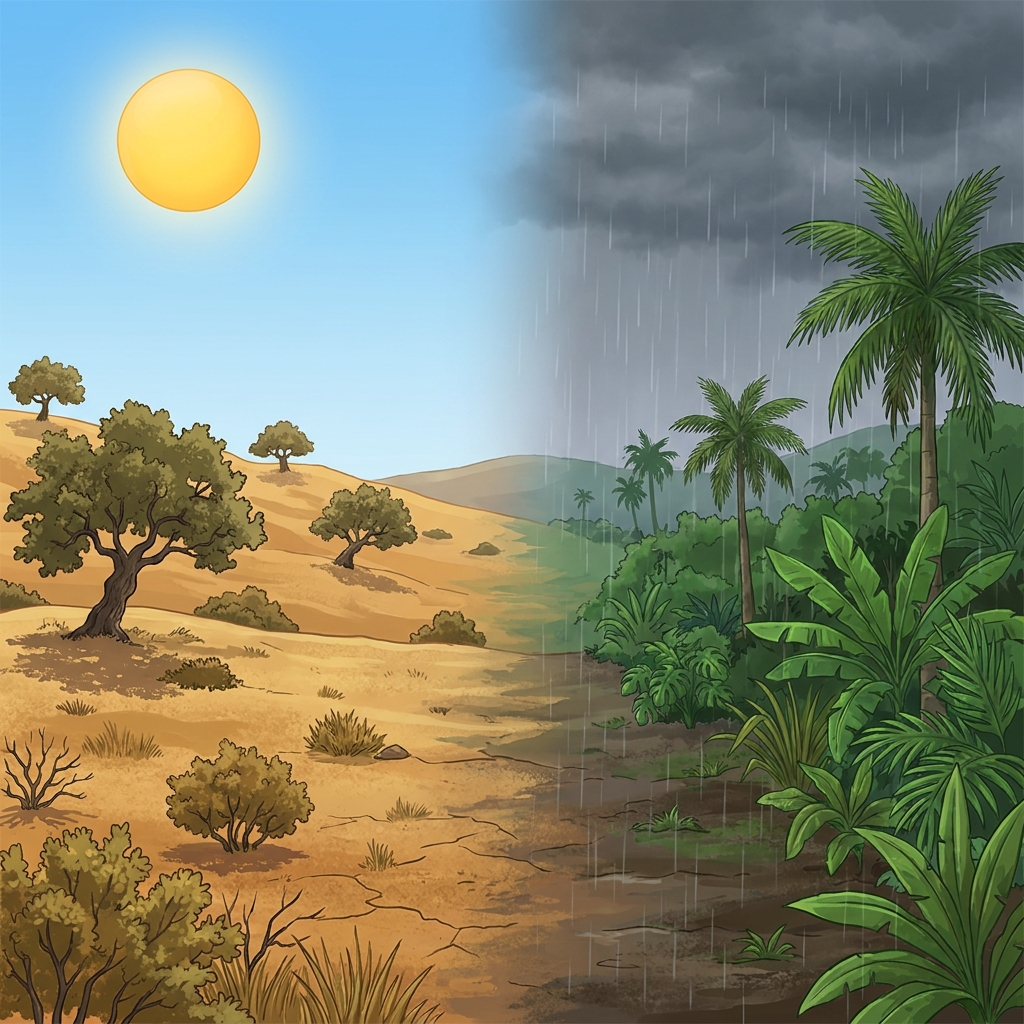
Understanding Climate Regions, Explores how different regions possess unique and predictable weather patterns
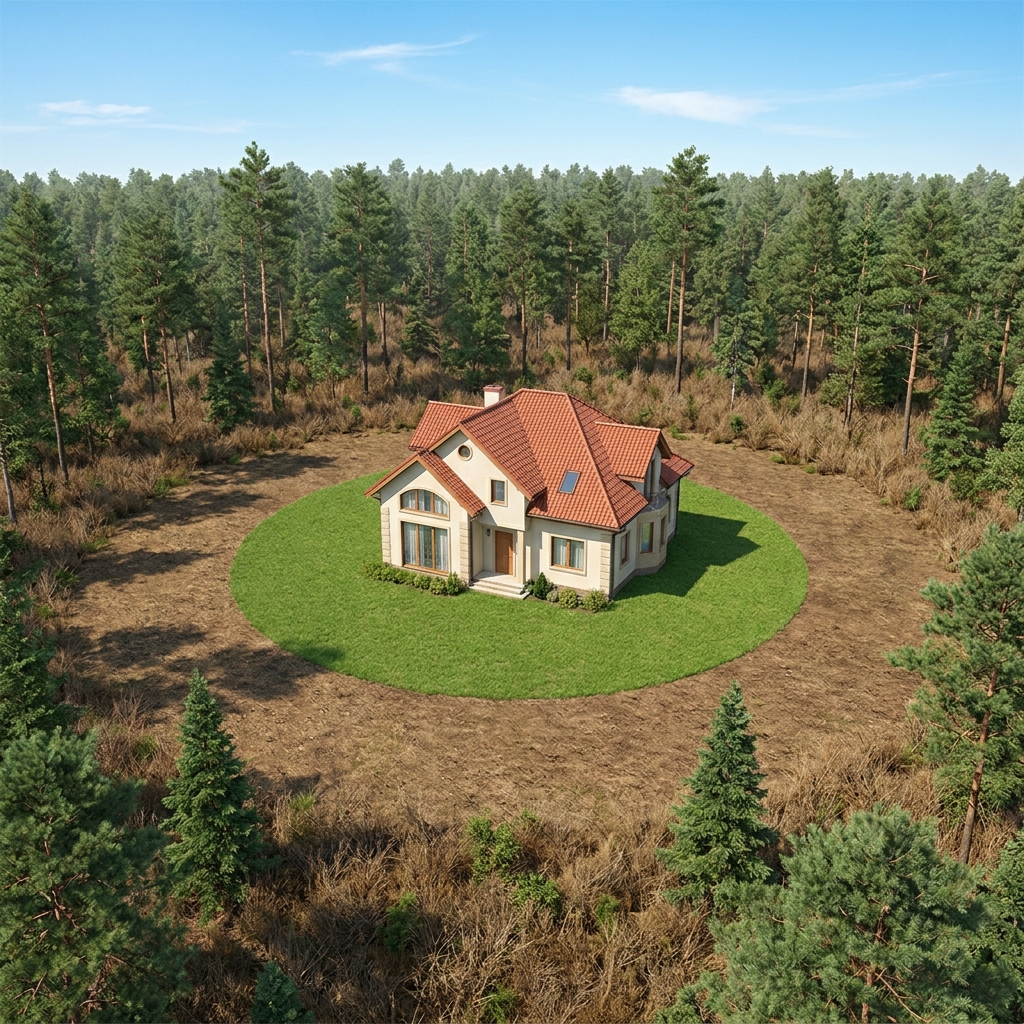
Staying Safe During Weather Hazards, Focuses on identifying and preparing for local extreme weather events
Designing for Safety, Covers engineering solutions to protect structures from seasonal weather impacts