

A parent once asked me if learning how to manage data was really necessary for a seventh grader who just wanted to play video games. I smiled and told them that the people who build those games do exactly what we cover in this middle school computer science lesson. We are looking at a specific unit today within the data and analysis sequence that fits into the seventh grade schedule. It often arrives in the spring when the calendar feels packed and teachers feel the time crunch of testing and end of year projects. When you are behind on your pacing guide or need a solid, self-contained lesson for a student who missed the previous week of instruction, Transforming Raw Data into Useful Information is a reliable resource.
The lesson focuses on the core concept of data transformation within the middle school computer science curriculum. It starts by grounding students in the reality that we are surrounded by sensors that record the world around us. A digital thermometer is the perfect example provided in the materials. It acts as a computational tool that logs temperatures automatically. The lesson asks students to consider how that information, once collected, is rarely ready to be used immediately. It remains raw data, which the material defines as unorganized information that has been collected but not yet processed or formatted for analysis. Students learn that their task as analysts is to turn that raw input into something that tells a story or solves a problem.
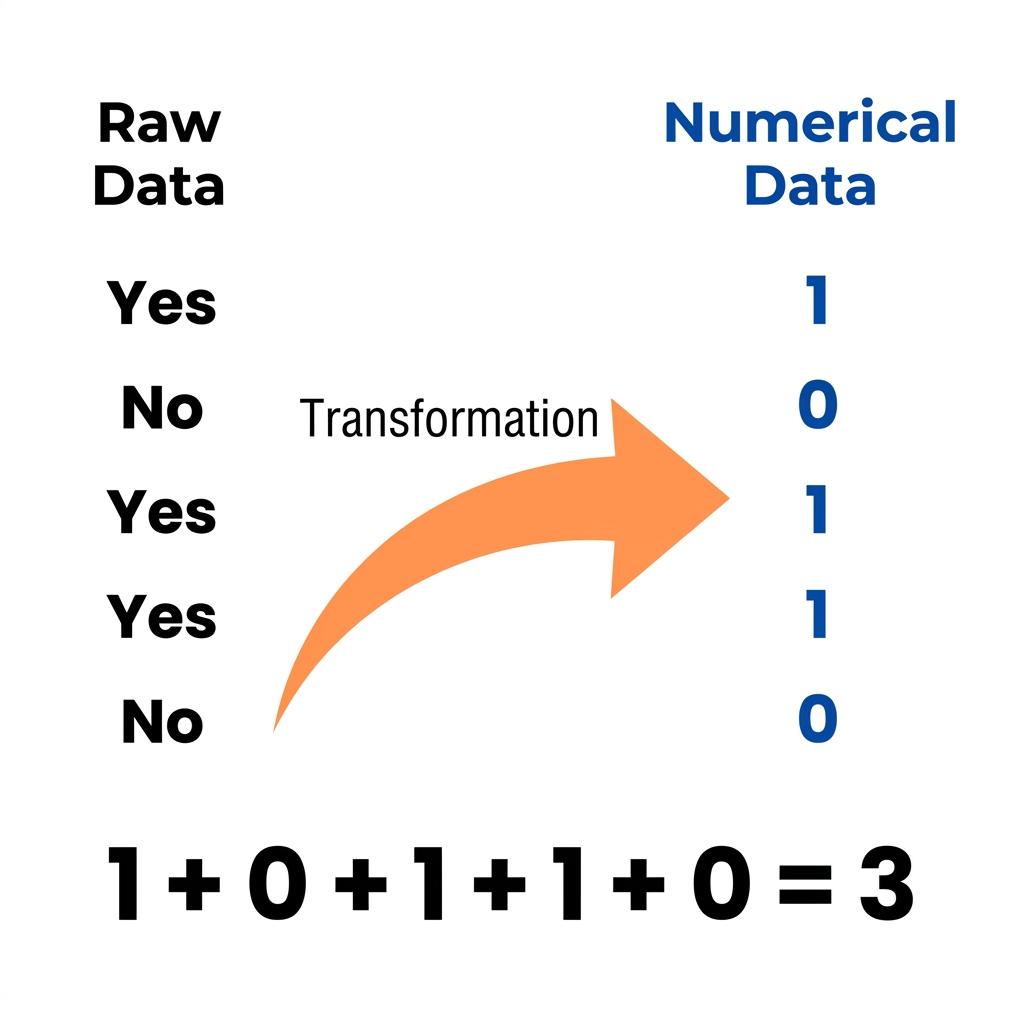
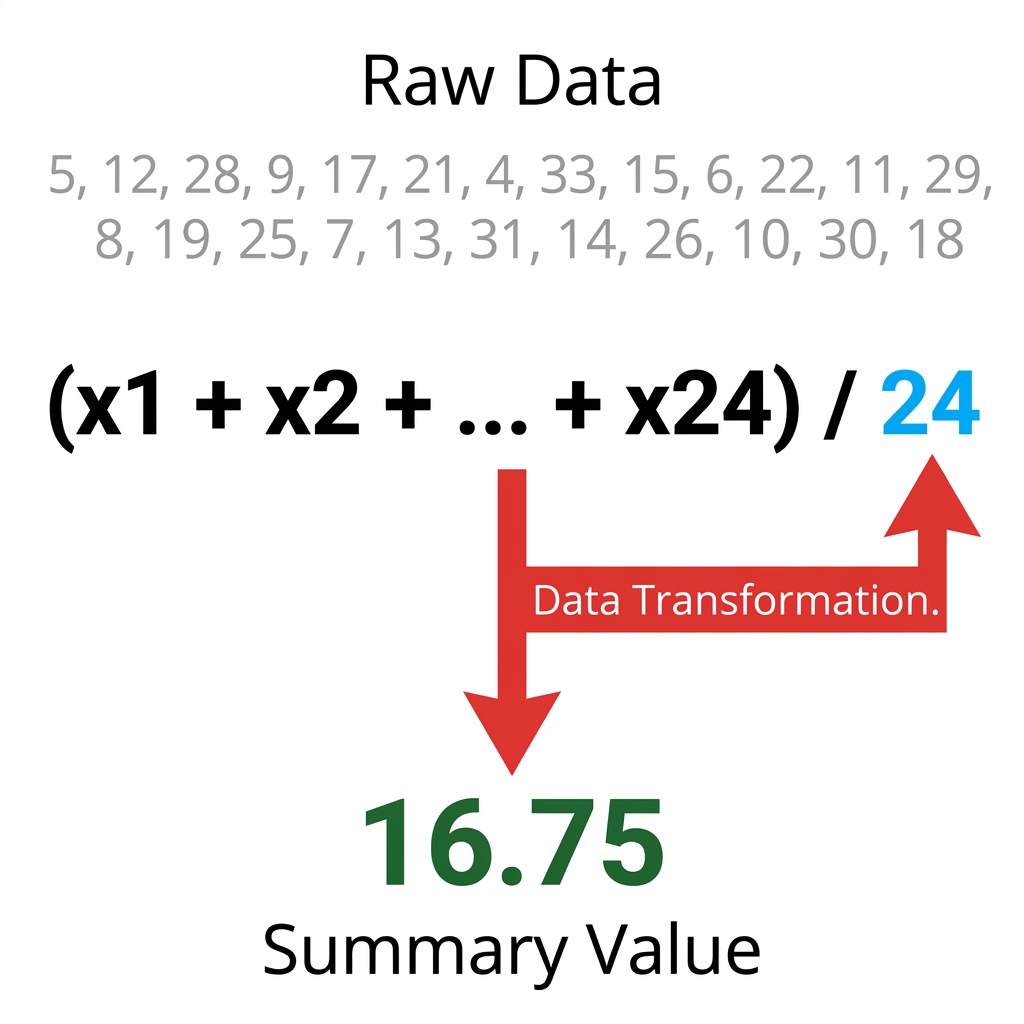
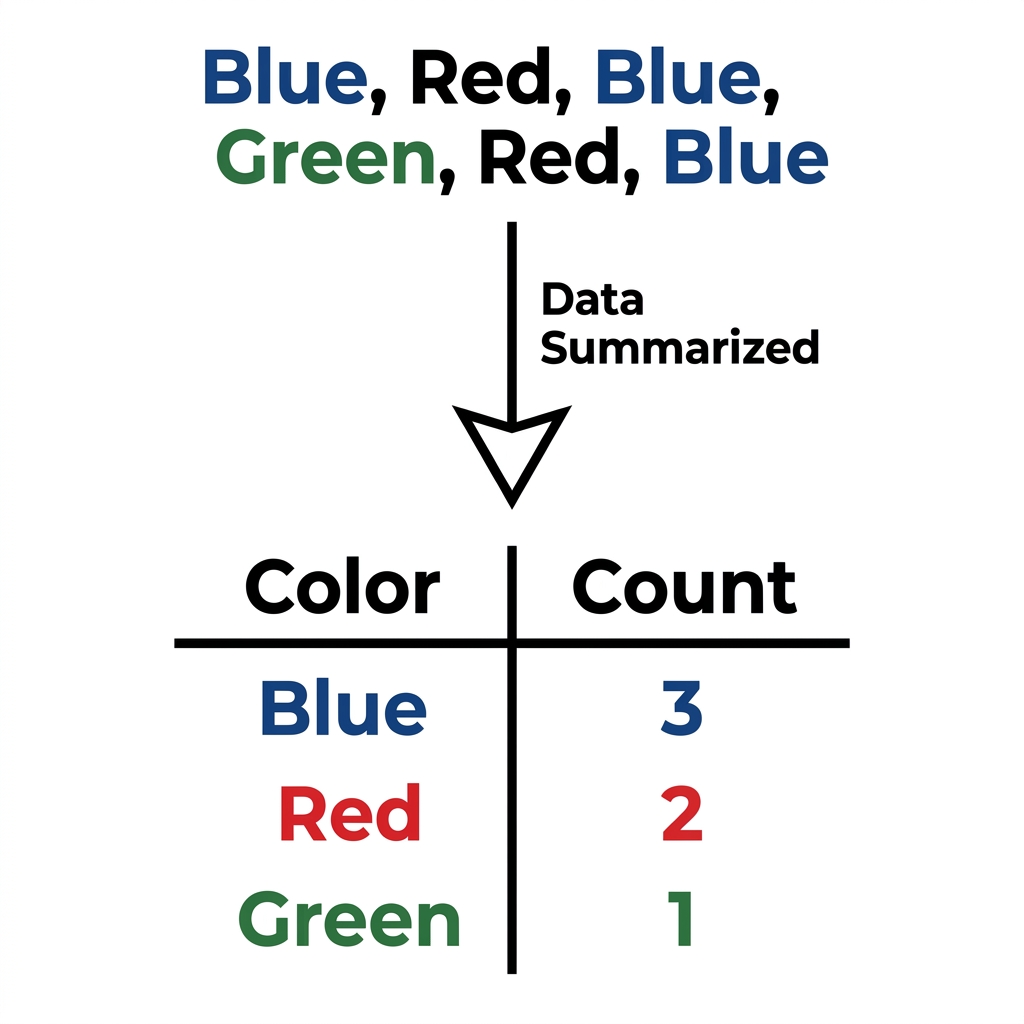
To guide them through this, the lesson introduces the concept of data transformation. This is the process of converting data from one format or structure into another to make it more useful. The material provides a clear scenario about survey responses. If you have a list of yes or no answers, it is hard to calculate a total. By transforming these into one and zero, you can sum the values instantly. It is a simple shift, but it highlights why we need computational tools like spreadsheets or sensors to process information. The lesson also uses a relatable example about battery life, explaining that sorting durations from longest to shortest helps a user identify the best performing device. This simple reordering shows that transformation is not just about complex math, but about making information readable and actionable.
Understanding the state standards
This material serves the California-adopted standard CA.CS.6-8.DA.8. This standard asks students to collect data using computational tools and transform the data to make it more useful. It is a fundamental expectation that bridges the gap between simply recording numbers and actually understanding what those numbers represent. Teachers in San Juan Unified, Ontario-Montclair School District, Live Oak Elementary School District, and Porterville Unified all use this same standard as part of their middle school computer science instruction. It is the same benchmark for students across the state. The standard asks students to take an active role in how they manage information, moving beyond passive observation into the role of a data scientist who cleans and organizes datasets to uncover insights.
When you have a student who needs a targeted intervention or a day of independent study, this lesson works well because it is self-contained. The scenarios, such as the sports scientist tracking athlete performance to help with training and health, provide a concrete reason for why this matters. Students see that this is not just an abstract coding exercise. It is a real world skill. One caveat is that the lesson moves quickly through the technical definitions. You might want to spend a moment checking that students understand the difference between raw data and processed information before they start the guided practice. If they get the definitions wrong early, the later exercises on sorting and converting values might feel confusing.
Practical application in the classroom
You can use this material for a whole-class assignment when you are first introducing the unit. It is also a perfect backup for a substitute day because the logic is linear and the examples are easy to follow. If you have students who are struggling to collect data using computational tools, this lesson breaks the process down into manageable parts. I find that seventh graders appreciate the examples that feel like real life rather than pure theory. The sports science example is particularly effective because it connects technology to something many of them already care about, which is performance and health.
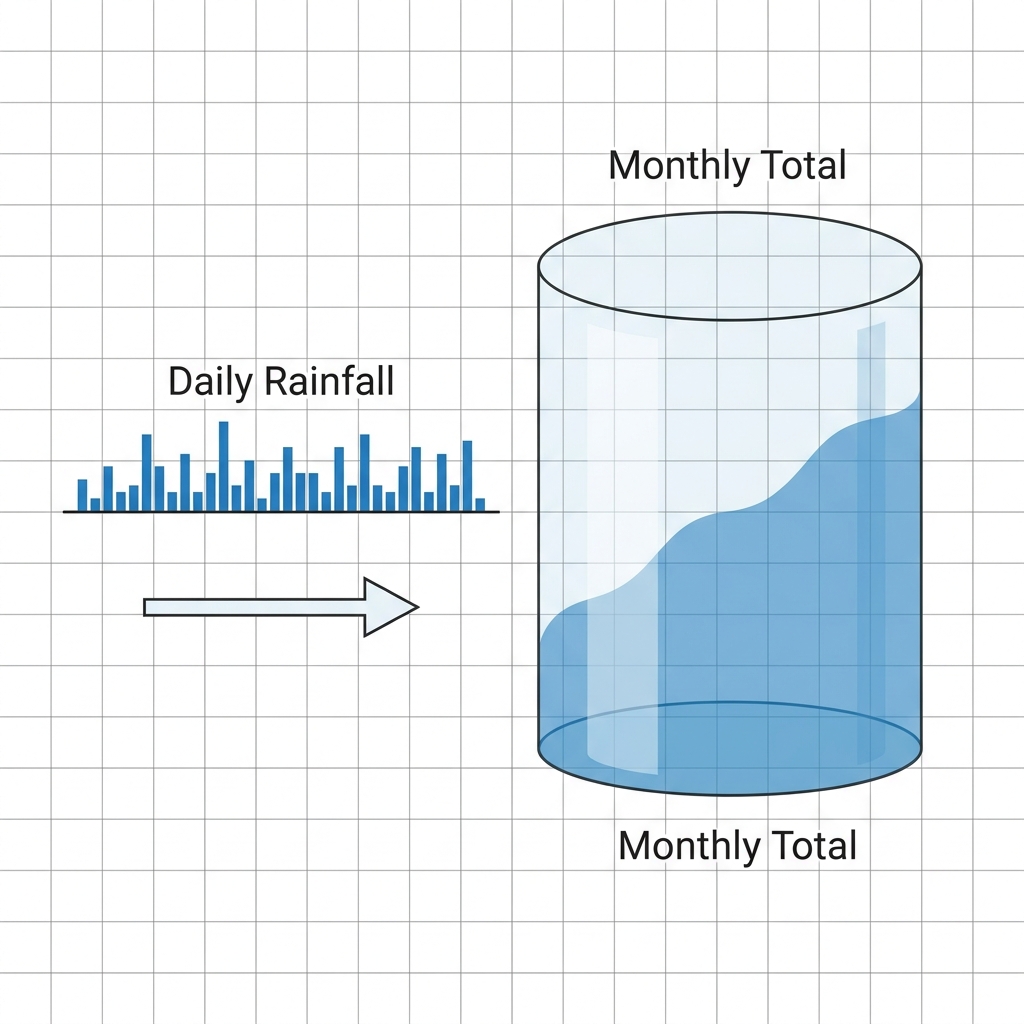
The lesson avoids unnecessary jargon and sticks to the core definitions of raw data, data transformation, and computational tool. By focusing on the transformation aspect, students learn that their ability to organize information is just as important as their ability to gather it in the first place. Whether they are using a spreadsheet or a physical sensor, the goal remains the same: create clarity from confusion. If you are preparing your middle school students for more advanced data work later in the year, this lesson provides the groundwork they need to succeed.
Related lessons
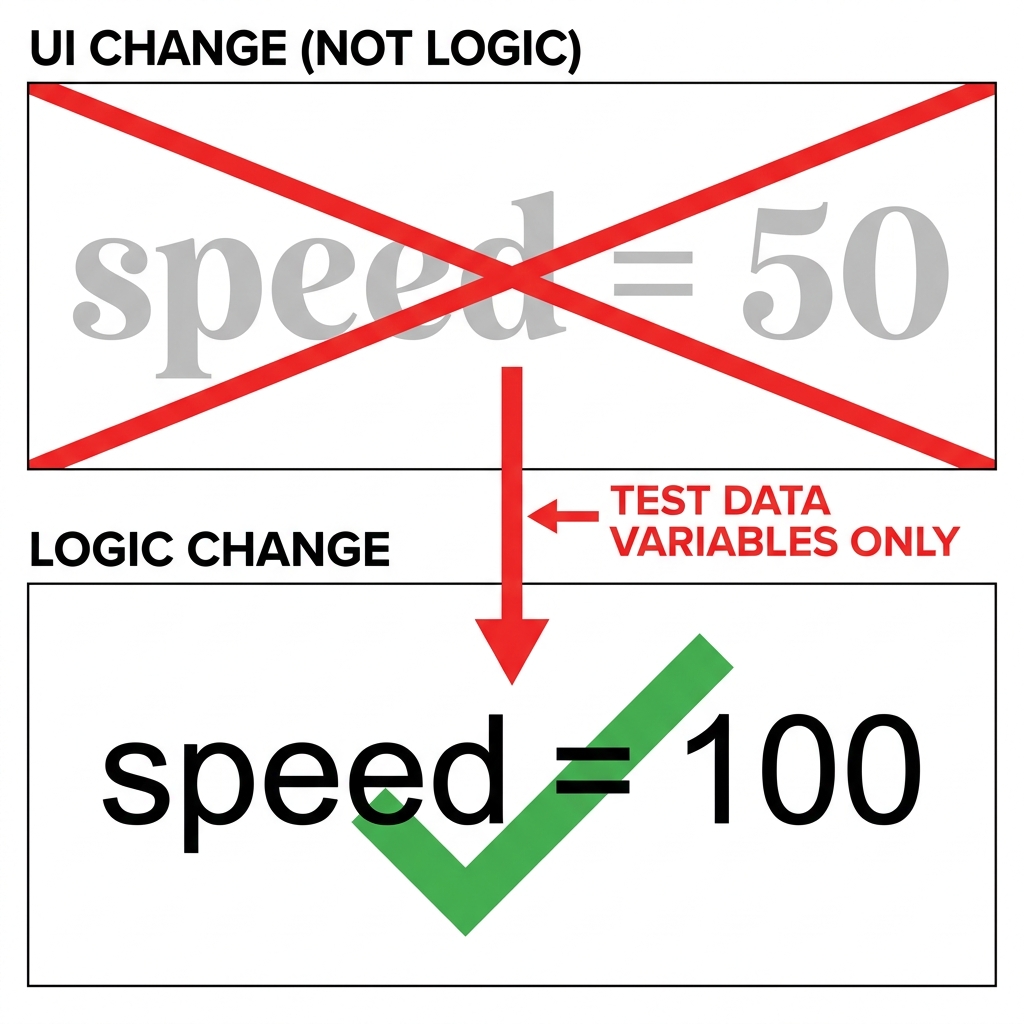
Testing and Analyzing Computational Models, Covers evaluating the accuracy and performance of different computational models
Choosing the Best Data Representation, Explains how to select effective visual formats for different datasets