

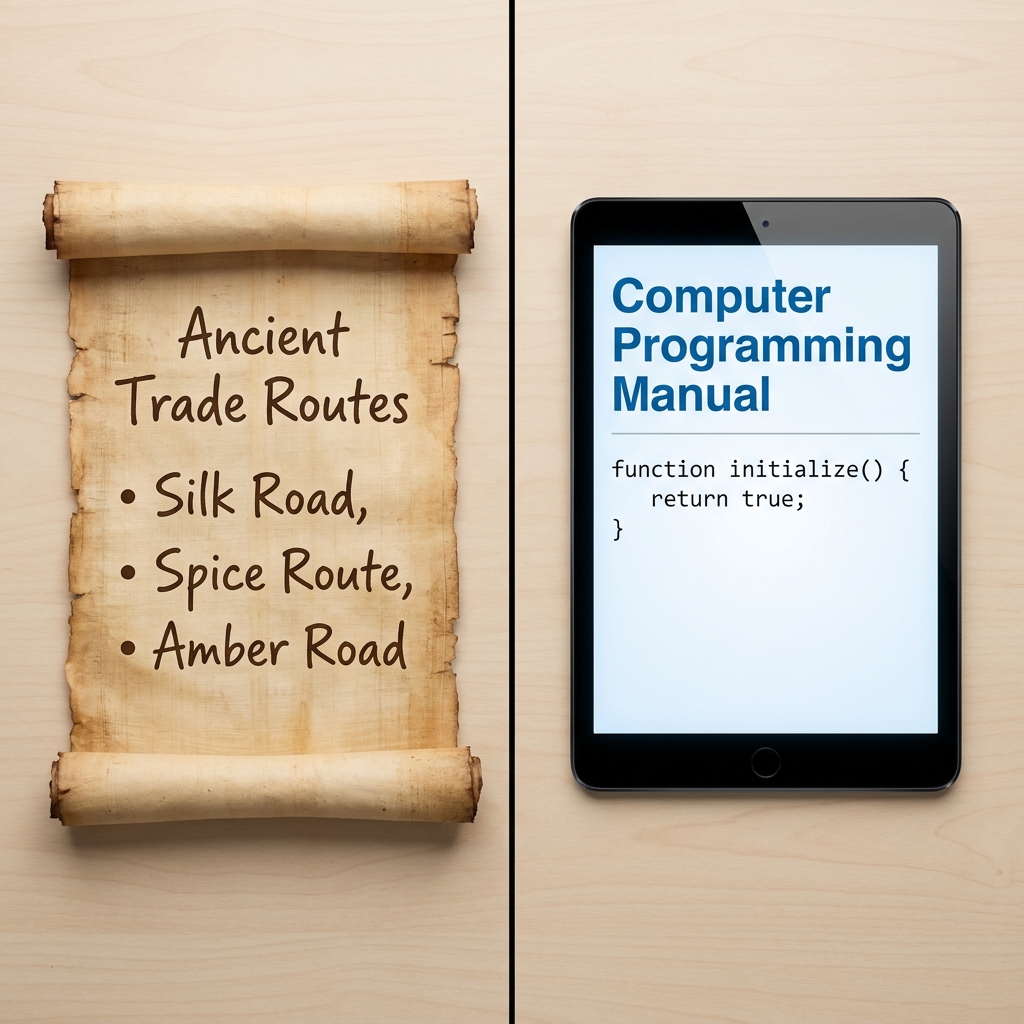
I would put this one early in the fall, in the first few weeks of seventh grade, before the history reading gets heavy. By October your students will be handed textbook spreads with a map on one page and three columns of dense prose on the facing page, and most of them will read the prose and skip the map. Or they will look at the map, find it pretty, and never connect it to a single sentence. Teaching the habit of reading the two together before that pattern sets in saves a lot of reteaching later.
The lesson is Connecting Maps and Texts, a seventh grade English language arts lesson from the literacy in history and social studies strand. It runs about 45 minutes, which in my experience means one full class period with a few minutes left for a quick check at the end. The stated objective is plain: students connect information from maps with details in written texts to understand history.
What the lesson asks students to do
The core move is integration. The lesson defines the word simply, as combining two or more things to make a whole, and that definition is worth putting on the board and leaving there for the period. Students are not being asked to summarize a map and then summarize a paragraph. They are being asked to say what the two sources explain together that neither explains alone.
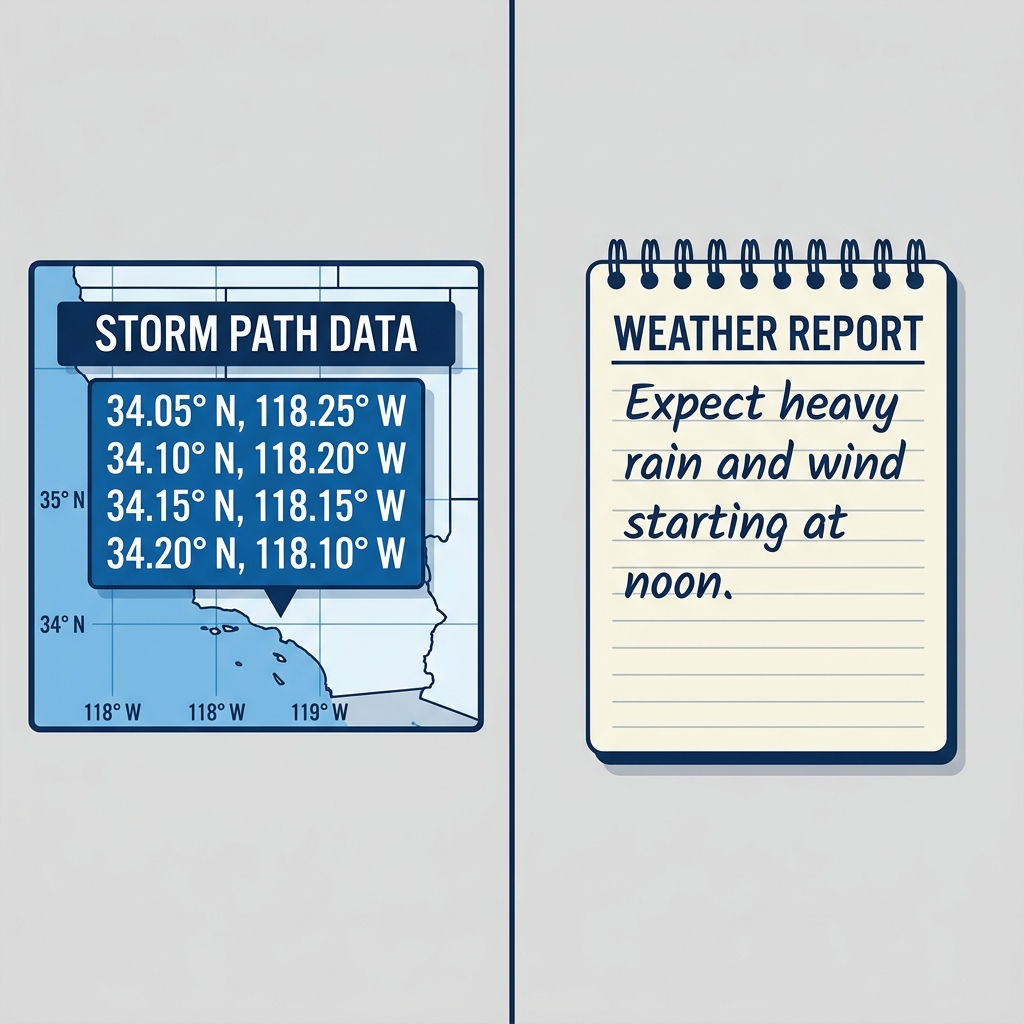
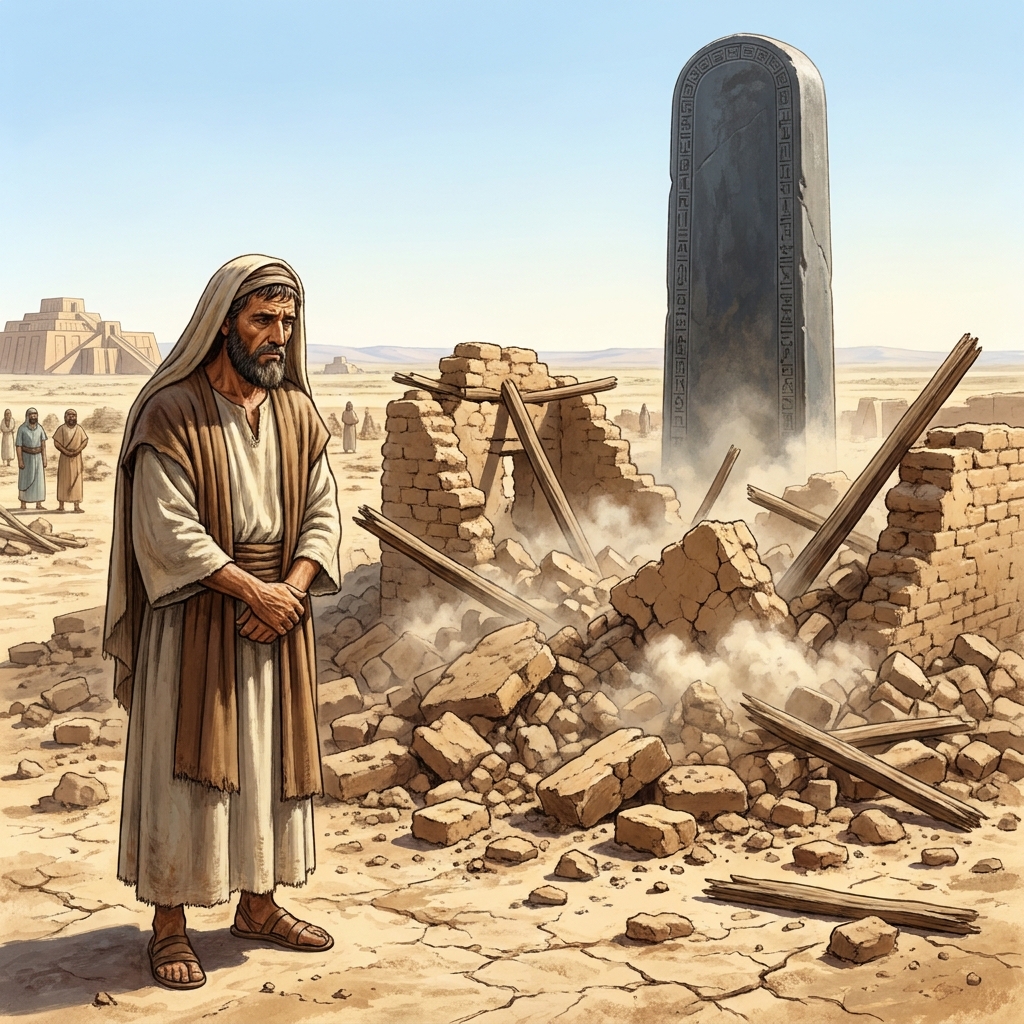
The opener starts in ancient Mesopotamia. Farmers lived on fertile land between two main rivers and engineered 4 irrigation canals to move water to their fields. The point the lesson makes here is a good one for twelve-year-olds: written records tend to tell you why something happened, while other sources (technical descriptions, diagrams, maps) show you how it was done. That distinction gives students a reason to care about the second source instead of treating it as decoration.
Two vocabulary terms carry the lesson:
- Integrate: to combine two or more things to make a whole.
- Fertile Crescent: a crescent-shaped region in the Middle East where early civilizations developed because of rich soil and water.
The second term does double duty. It is history content, and it is also a small lesson in itself about why a place name and a shape on a map belong together. If your students have already met the Fertile Crescent in sixth grade history, this is a nice moment of recognition. If they have not, spend an extra minute on it.
The standard behind it
The lesson is built on CA.ELA.RH.6-8.7, part of the California Common Core State Standards for English language arts, in the Reading: Literacy in History/Social Studies domain and the Integration of Knowledge and Ideas cluster. The standard asks students to integrate visual information, the kind found in charts, graphs, photographs, videos or maps, with other information in print and digital texts.
I like this standard more than most. It is one of the few that names the actual mess of a real history page: the caption, the chart in the corner, the photograph that may or may not match the paragraph next to it. Students in Moreno Valley Unified, Garden Grove Unified, Delhi Unified and Golden Valley Unified are working toward this exact same expectation, because it is a statewide standard and reads the same from one district to the next.
One honest caveat. The title says maps, and the opener leans that way, but the worked example and the guided practice lean on data and written records more than on maps proper. I do not think that is a flaw, since the standard itself covers charts and graphs, but if you specifically want students staring at a map with a compass rose and a legend, plan to bring one in for a few minutes after the lesson.
Where the time goes
The opener is short. Most of the period sits in the worked example and the guided practice, and that is where it should sit.
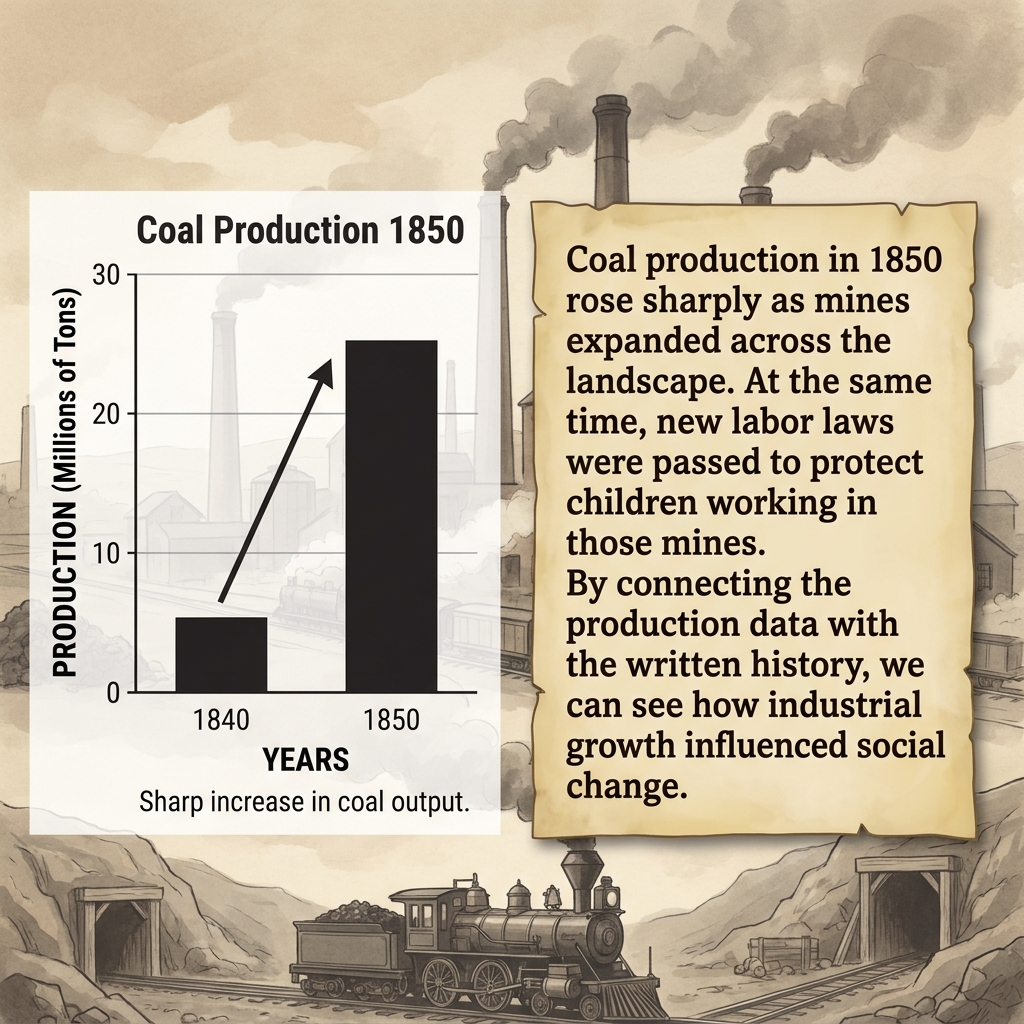
The worked example uses the Industrial Revolution. Records show London’s population rising from 1 million to 2 million between 1800 and 1850, and a report from the time describes the city as bursting at the seams with workers moving in from the countryside. The lesson then pairs those two pieces: the numbers show how much the city grew, and the report explains where the people came from. Together they give a cause for the urban growth.
I would slow down here more than the lesson seems to expect. Have students say the integrated claim out loud in one sentence before moving on. Something with both a number and a reason in it. Kids who can do that are ready for guided practice. Kids who give you only the number, or only the quote, need one more pass.
The why-it-matters section is brief and reaches past history: news articles with maps, instructions with diagrams, financial reports. It also adds a note about videos, which the lesson describes as dynamic visual sources that capture movement and change over time. The advice there is good and specific. When pairing a video with a written narrative, students look for how the visual action confirms or expands on the events in the text. That is a useful frame to keep for later in the year when you show film clips in history.
What to watch for during guided practice
Guided practice pairs textile exports with a merchant’s diary. Students get export information on one side and a first-person account on the other, and they have to put them together.
Here is where students slip. Most will treat the diary as the real source and the export information as a fact to copy into the first sentence. Watch for answers that sound like two separate summaries glued with “and.” The better answers use one source to explain the other: the exports show a change, and the diary tells you what that change looked like to someone living through it, or why it happened.
The second thing to watch is the reverse problem. A few students will over-trust the numbers and dismiss the diary as “just someone’s opinion.” That is worth a short conversation. A merchant’s diary is a perspective, yes, but the standard is about combining sources, not ranking them. The diary is often what makes the numbers mean anything.
A quick move that helps: ask each student to underline one phrase in the diary that the export information confirms or complicates. It forces the connection to be specific, and it gives you something to glance at as you walk the room.
As for uses beyond a regular class period, this lesson fits a whole-class assignment early in the year, and it works well for a student who missed the week, since the vocabulary is light and the examples carry their own context. It is also a reasonable substitute-day lesson. The 45-minute length matches a period, the structure moves from example to practice without needing much teacher setup, and the guided practice gives a sub something concrete to collect.
If you are building a fall unit and want a seventh grade lesson on integrating maps and texts in history, open it before you plan the week and read the guided practice yourself first. Decide ahead of time what a strong integrated sentence about the textile exports and the merchant’s diary sounds like, so you know it when a student writes one.
Related lessons
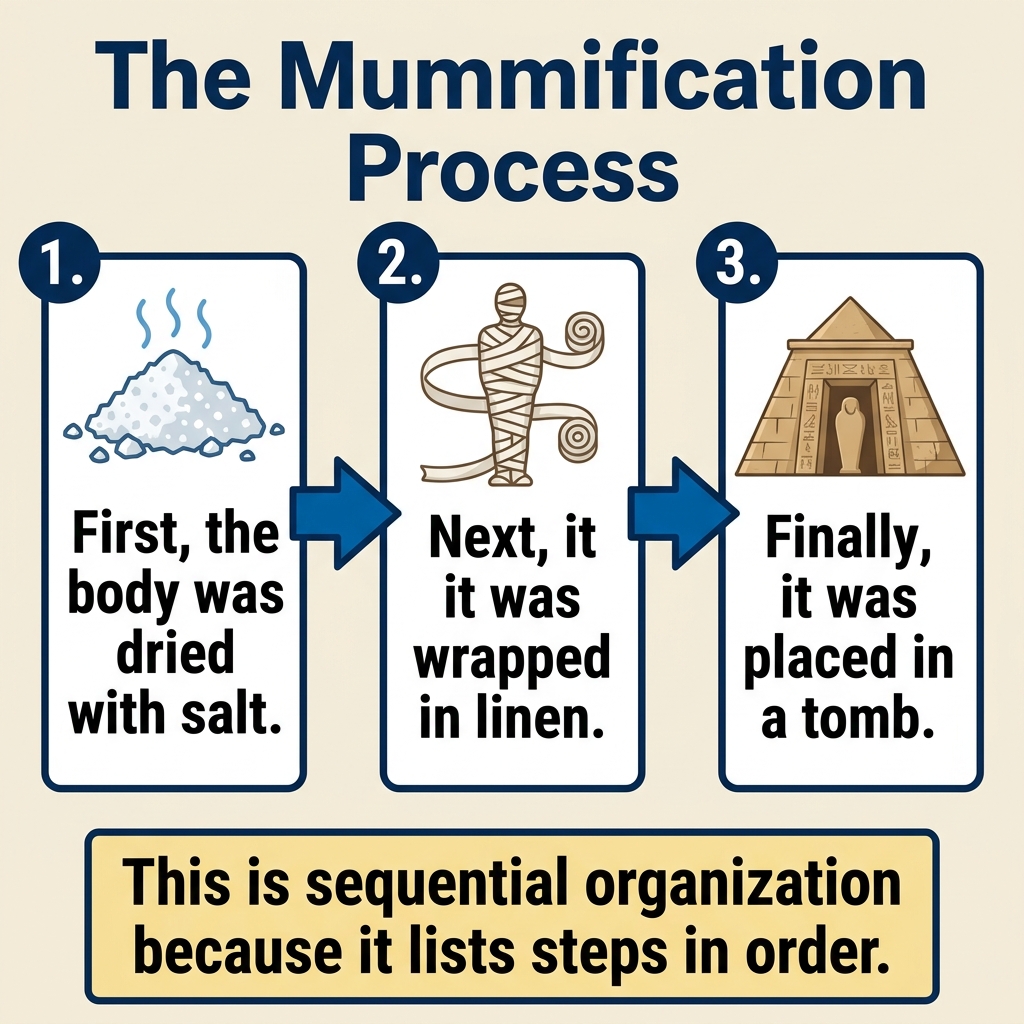
Understanding How Authors Organize Information, how writers structure information so readers can follow it
Using Evidence to Support Your Ideas, backing up claims and ideas with evidence from texts
Reading Between the Lines: Understanding Authorial Intent, figuring out what an author means beyond the literal words