

By the time your fifth grade students reach the middle of the school year, they have seen enough charts and graphs to know that numbers exist, but they often struggle to see what those numbers actually communicate. This Using Data to Tell a Story lesson bridges that gap by moving from simple counting to genuine analysis. It lands well when you are looking to integrate computer science with other subjects, especially since it focuses on the logic of information rather than just coding syntax. In my experience, ten and eleven-year-olds are more than capable of analyzing information, but they need a framework to distinguish between raw noise and meaningful evidence. This lesson provides that structure by focusing on how we organize information to spot trends.
How data storytelling works for your fifth graders
Teachers in San Bernardino City Unified, Long Beach Unified, Rowland Unified, and West Covina Unified are teaching this same standard as part of their district curricula. Whether you are prepping for a full class period, pulling a small group for intervention, or setting up an independent study module, this lesson provides a clear, grounded introduction to the world of data. The core concept is straightforward: data visualization is the process of using charts or graphs to show information so that patterns and relationships become easy to see. If students cannot look at a graph and tell you what is happening, the graph has failed its purpose.
The mechanics of teaching students to identify trends
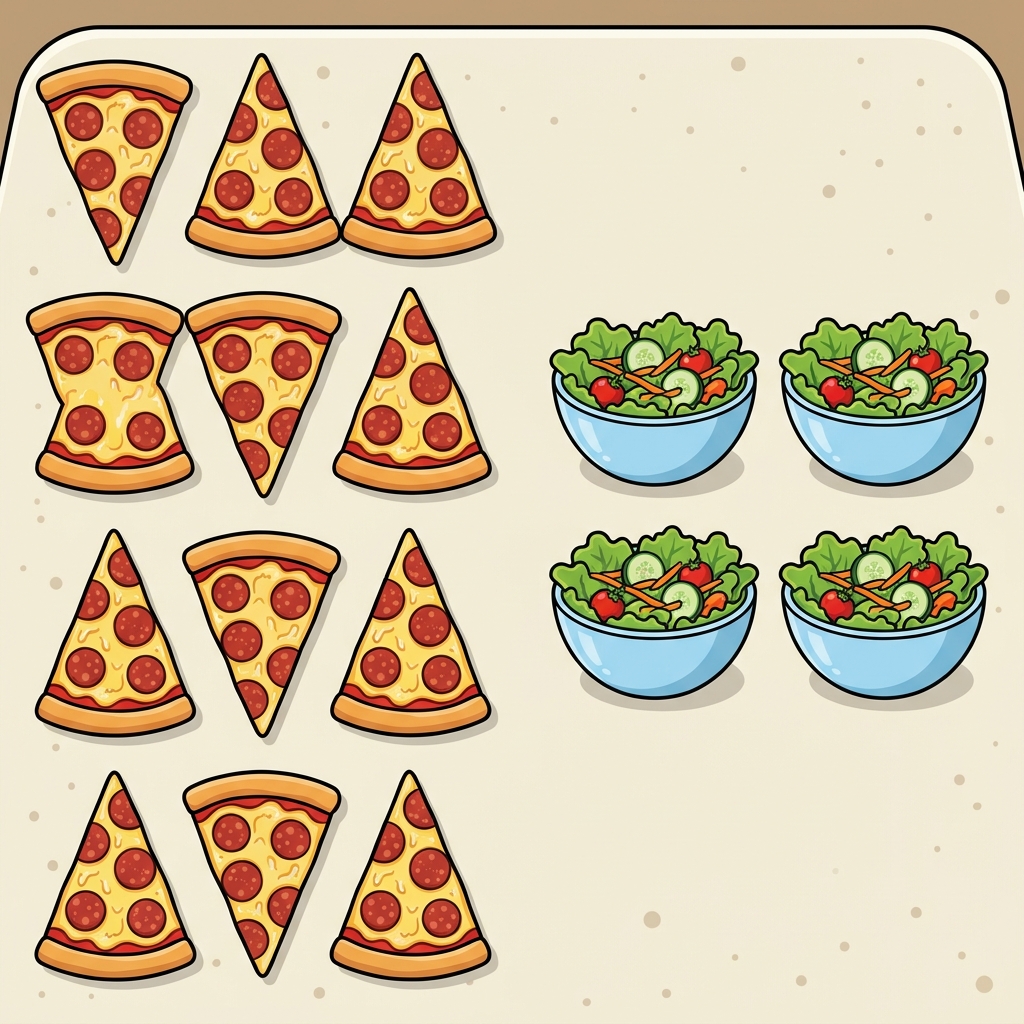
The lesson begins with a practical, low-stakes look at school life. Instead of starting with abstract datasets, it asks students to think about how they might organize information about their own environment. It uses the example of a cafeteria manager counting lunch choices, specifically, the twelve students who chose pizza compared to the four who chose salad. This helps students realize that data is just a collection of facts, numbers, or observations about the world. When you group that information, comparisons become automatic. This foundational work helps students understand why we bother with labels and categories in the first place.
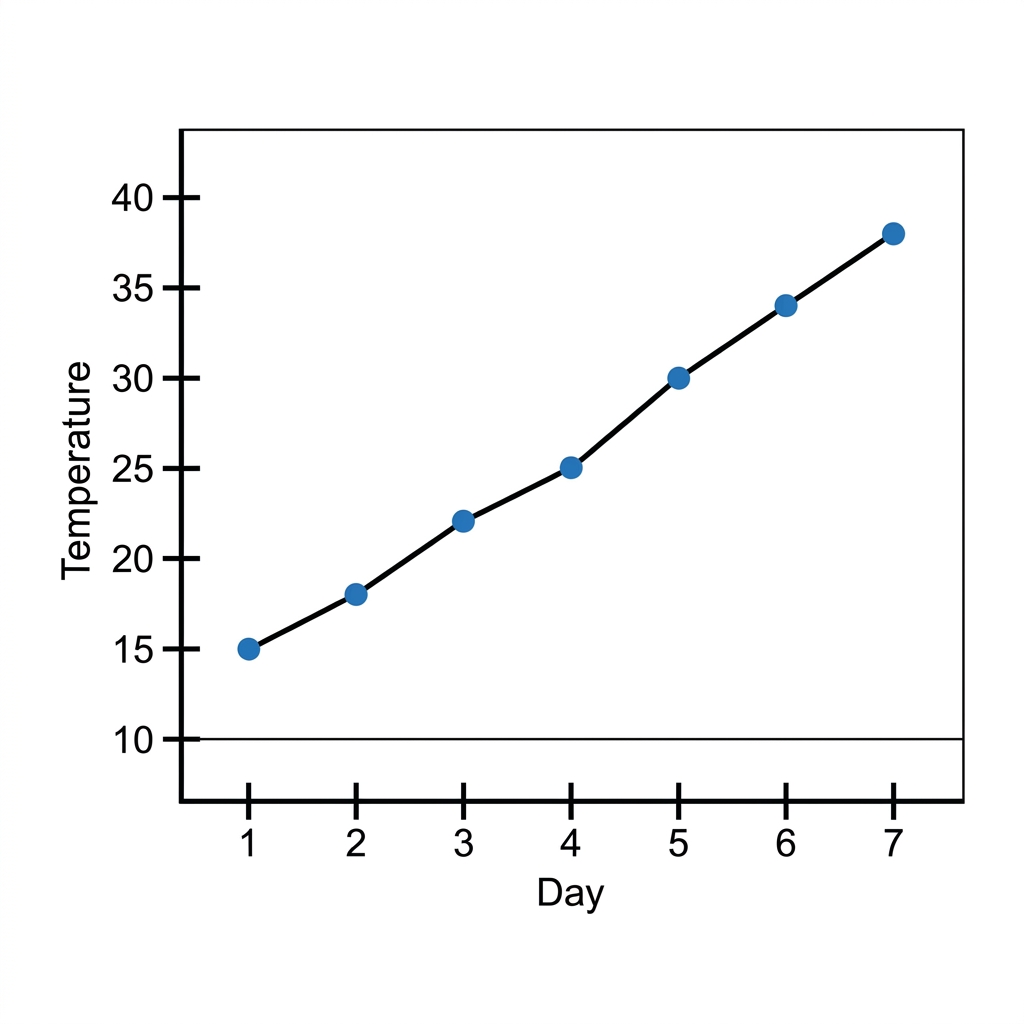
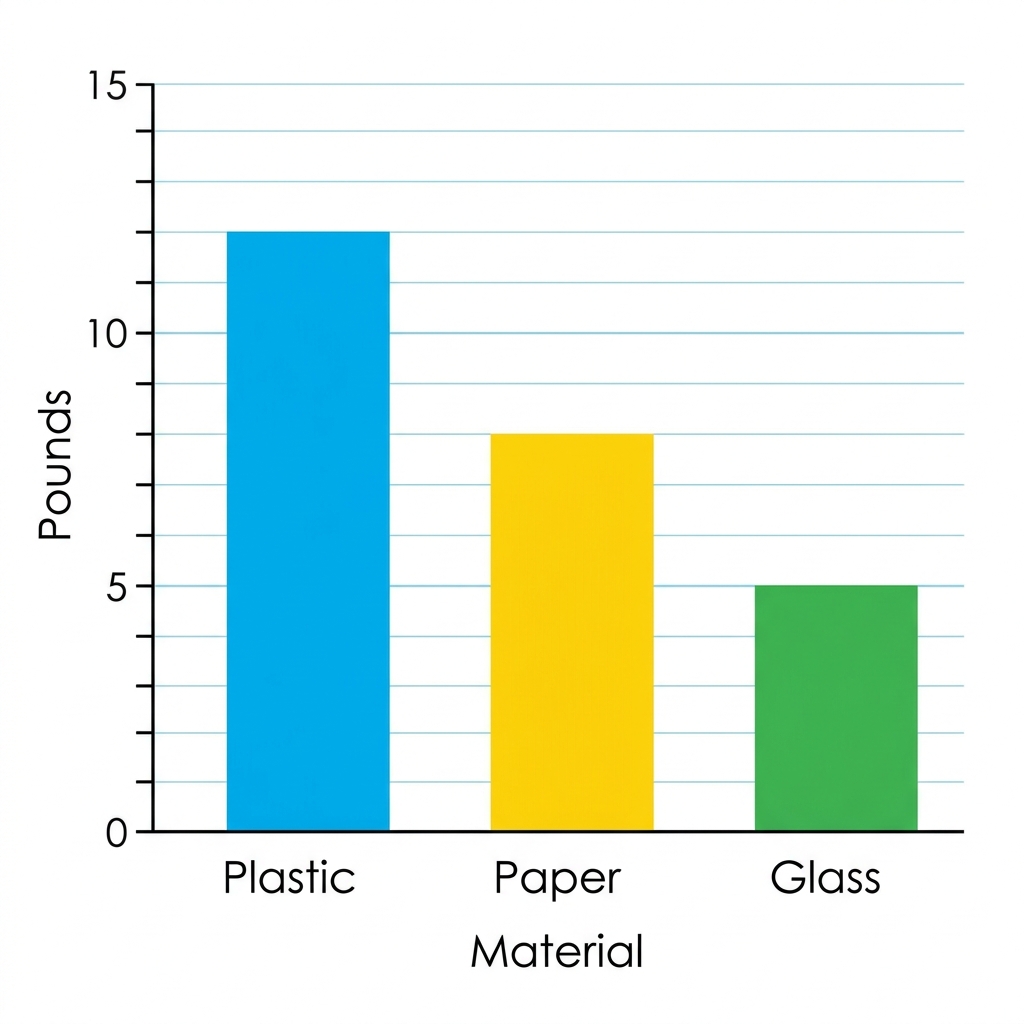
From there, the lesson defines a trend as a pattern in data that shows how something changes over time. It gives the excellent example of a school recycling program: if the volume of paper collected increases month over month, that is a positive trend. It tells a story of progress. This is the moment in the lesson where students really start to see the value of their work. They are not just plotting points; they are documenting a narrative of success. I have found that when students look at data visualization for 5th grade, they stop seeing charts as busywork and start seeing them as communication tools.
The standard at the heart of this work is CA.CS.3-5.DA.9. This California-adopted standard asks students to use data to highlight or propose relationships, predict outcomes, or communicate ideas. It is not enough for a student to know how to build a bar graph in a spreadsheet tool; they must be able to use that graph to argue for a change or explain a situation. The lesson does a good job of pushing students beyond the “how” to get to the “why” behind the numbers.
Using data to propose change
The guided practice moves into the real-world application of this standard. Students examine energy consumption in a school building, defined here as the amount of electricity a building uses. The prompt asks students to use this data to propose a plan for saving power. This is where the lesson requires some teacher facilitation. You might find some students struggle to move from noticing a high number on a chart to proposing a logical change in behavior. This is normal. You should ask them exactly what the data implies: if the data shows high energy usage after 3:00 PM, what policy might a city leader or school administrator change to fix it?
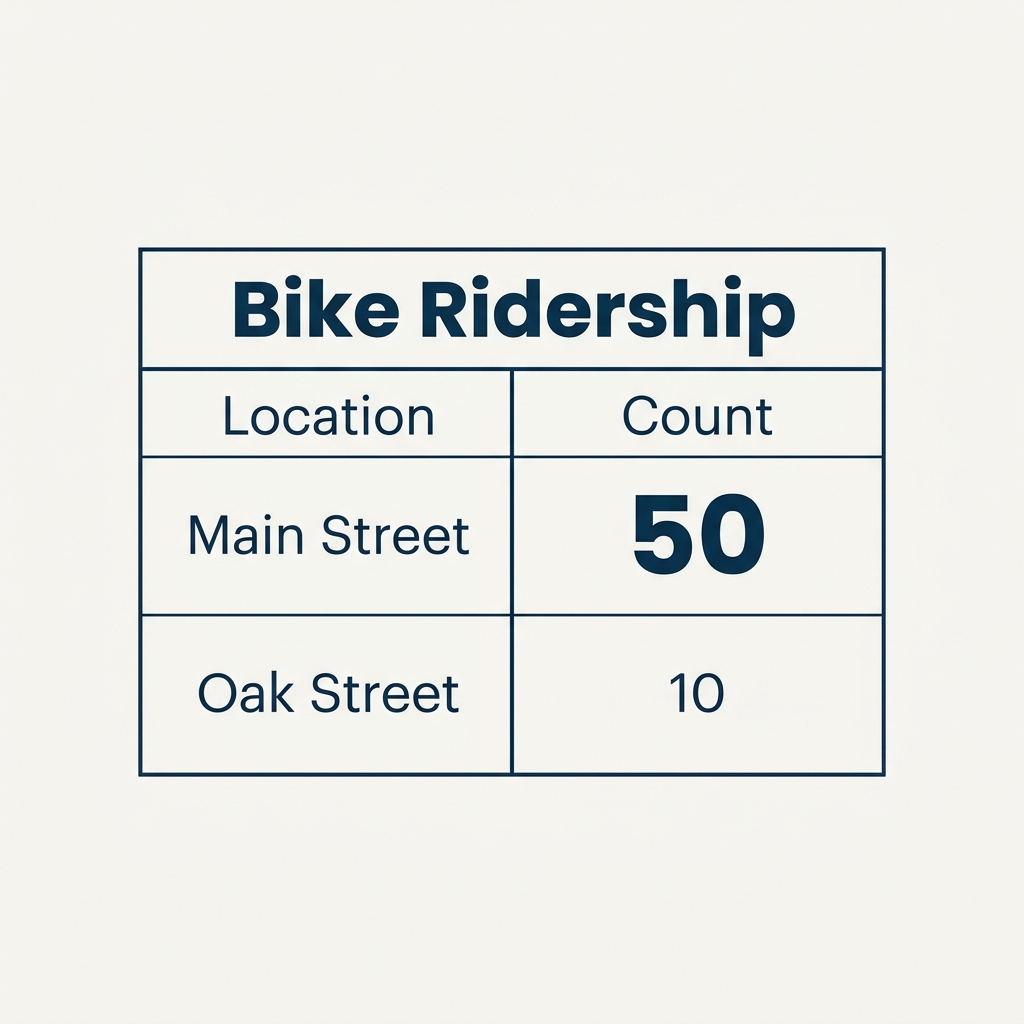
The lesson introduces the concept of public policy as the decisions governments make to improve community life. It emphasizes that when citizens present data to leaders, they are using that information to influence those decisions. This helps students understand that data is not just something you find in a textbook; it is a tool for civic engagement. My one caveat for you as you teach this is to ensure students have enough context to interpret the energy data accurately. If a graph shows a spike in electricity usage, they need to know what that spike represents before they can suggest a fix. Once they grasp that relationship, the connection between data and storytelling becomes much sharper.
This lesson is a strong candidate for an independent study session or a day when a substitute will be covering your class. The instructions are direct and the scenario is easy to follow without constant supervision. It is rare to find a technical lesson that manages to feel this relevant to the way we live our daily lives. By the end of the 45-minute block, students should be able to articulate why a certain trend in a chart matters, which is the exact skill requested by the standard. They are learning to see what is really happening in their own schools, which is the first step toward being thoughtful, data-literate participants in their own communities.
Related lessons
Making Data Speak, Teaches students how to interpret and communicate complex data findings
Digital Storage: Data Types and Detail, Explains how different types of digital information are saved