

Getting past the common student hurdle
I was grading a stack of lab reports yesterday, and a student wrote that if you simply provide more water, a bird population will grow indefinitely. It is a common mistake. Students often miss the finite nature of an environment because they assume population growth is a linear climb rather than a system of checks and balances. This 7th grade science topic is one of the most practical parts of our curriculum because it forces students to move past simple addition and toward an understanding of systems.
When we introduce Resources and Ecosystems, the goal is to shift that mindset. Students start with a simple opening exercise about a backyard garden. Plants need water to survive and grow to their full size, just like animals need consistent access to food and shelter. This is a perfect entry point for the concept of carrying capacity. This is the exact same standard taught in Sweetwater Union High School District, Long Beach Unified, Ocean View School District, and Sunnyvale School District. Educators across California use this approach to help students see the physical link between a habitat and the population it can support.
How the lesson breaks down the math of survival
The core of this 7th grade science ecosystem lesson is built around three definitions: an ecosystem, a resource, and carrying capacity. The material defines an ecosystem as a community of living things interacting with their physical environment. It frames a resource as any material or energy source that an organism needs to survive and reproduce, such as water, food, or nesting space. Finally, it introduces carrying capacity as the maximum number of individuals of a particular species that an environment can support based on available resources.
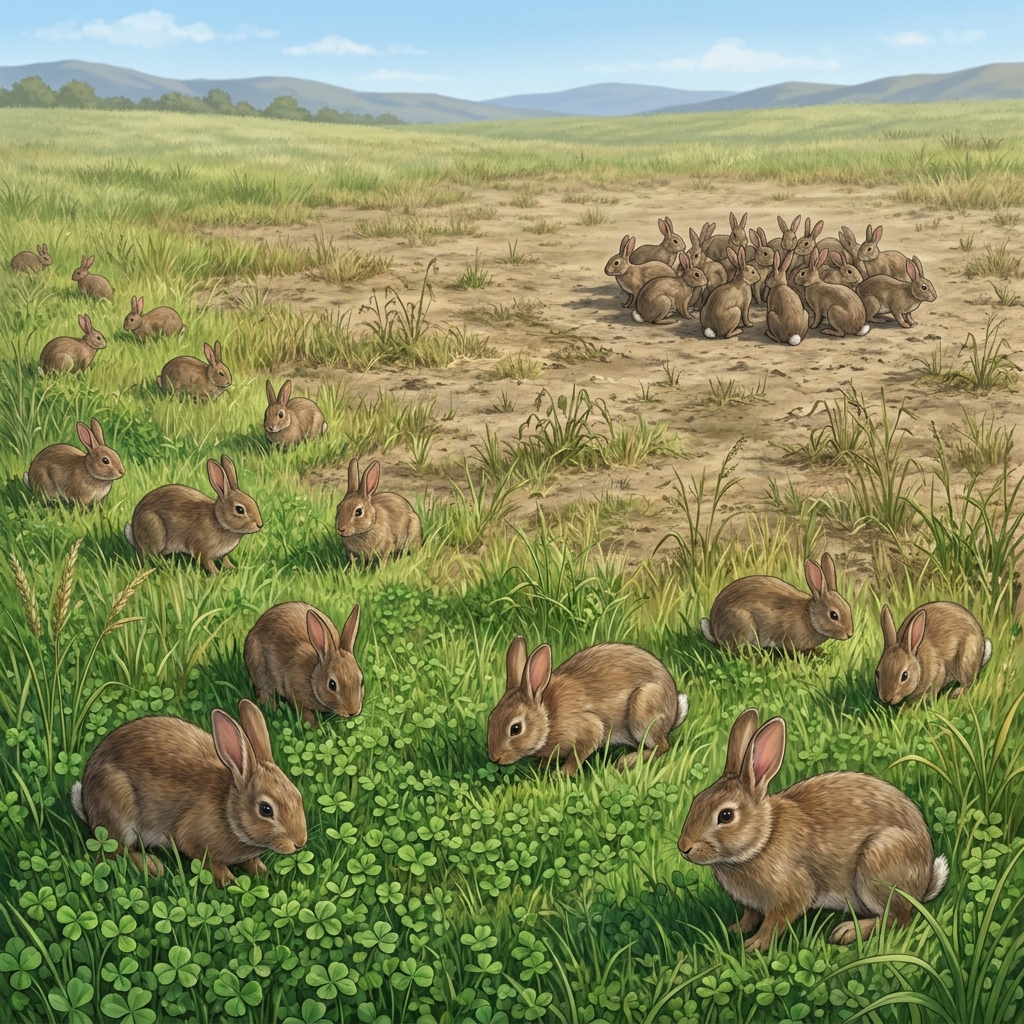
The lesson uses the example of a bird feeder to illustrate these concepts. It is a clear, manageable scenario for 7th graders. By changing the amount of available birdseed, the class can see how the number of visitors changes. The logic is simple enough for students to grasp but provides the foundation for the more complex analysis required by the California standards.
Analyzing real-world data to build evidence
The lesson centers on MS-LS2-1, which is the California-adopted standard asking students to analyze and interpret data to provide evidence for the effects of resource availability on organisms and populations in an ecosystem. The lesson provides a great scenario involving salmon egg survival in a river. Students look at data where water flow at 100 units results in 80 percent egg survival, while a drop to 40 units cuts survival down to 20 percent. It is a striking visual of how resource availability impacts health.
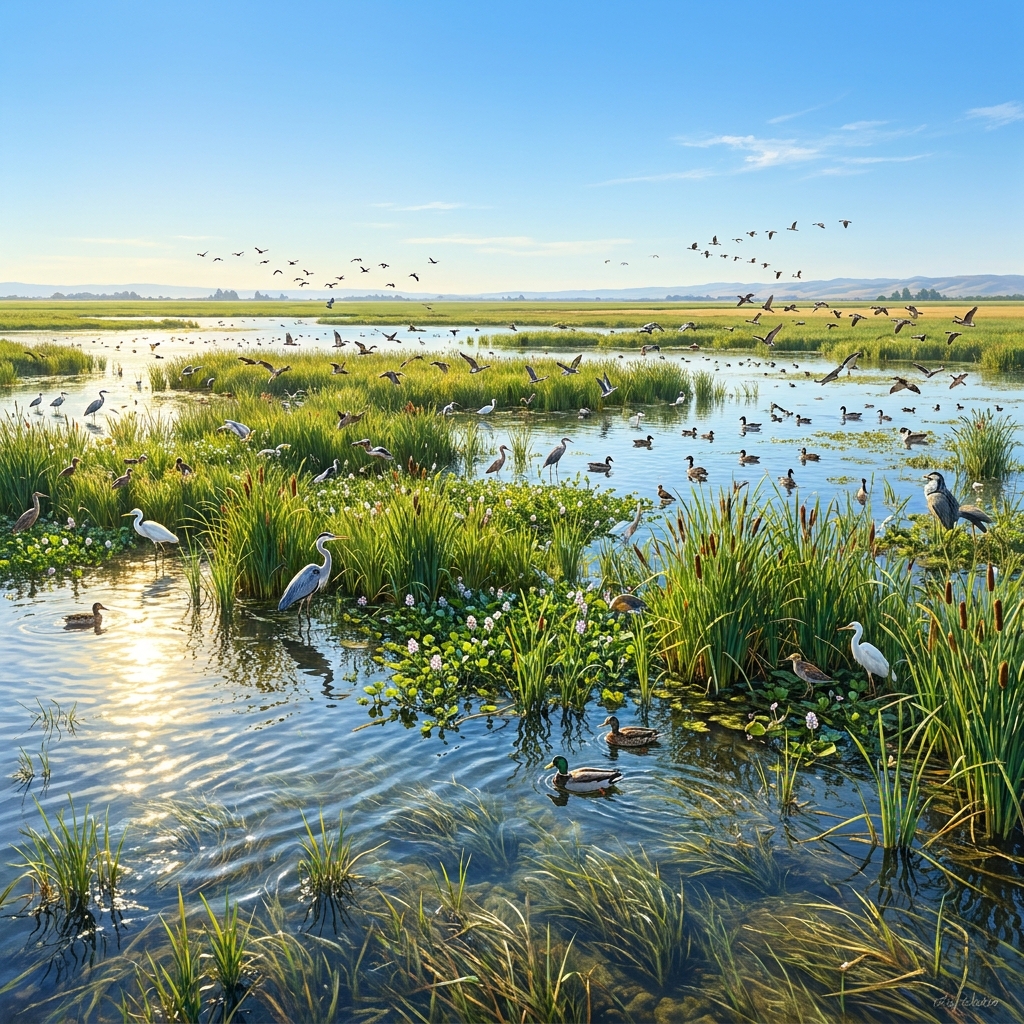
The lesson expands on this by asking students to look at Central Valley wetlands. During a dry year, the water is low, and the habitat supports fewer birds. In a wet year, the abundance of water and food allows the wetland to support a larger population. This provides the concrete evidence students need to prove that environments have limits. It is a strong way to show them why environmental scientists manage land and water to prevent the destruction of habitats for endangered species.
Where this lesson fits in your classroom
This lesson is designed to be completed in about 45 minutes, which makes it perfect for a whole-class assignment or a substitute day when you need something that is both self-contained and cognitively demanding. It also works well for a student who missed the week and needs a quick way to catch up on the life science concepts of population dynamics. You might find that some students struggle to switch from the qualitative idea of a garden to the quantitative data of the salmon eggs. If that happens, have them map out the units of water versus the percentages of survival on a simple coordinate plane. It helps bridge the gap between reading a chart and understanding the ecosystem impact.
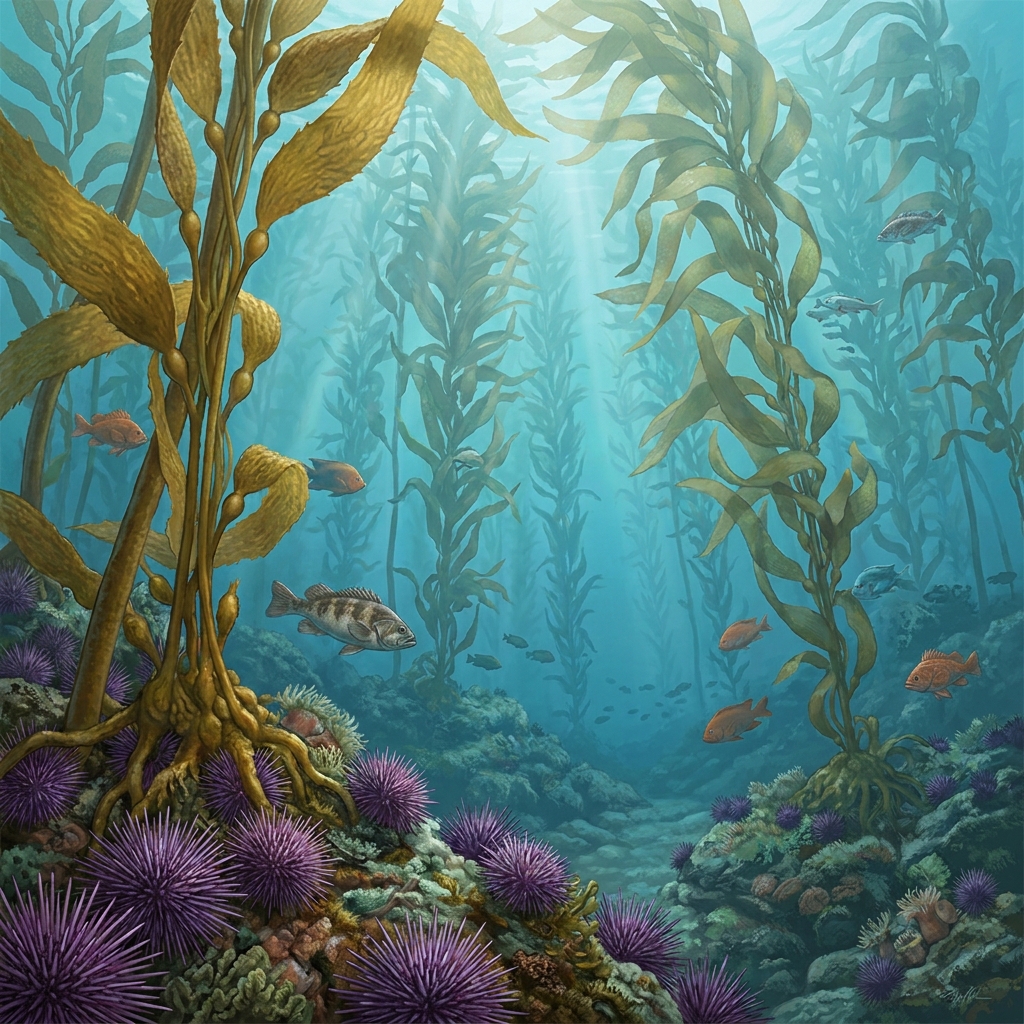
By the time they finish, your students should be able to explain how changes in available resources directly drive the size of animal populations. It is a direct, no-nonsense look at how the natural world manages itself.
Related lessons
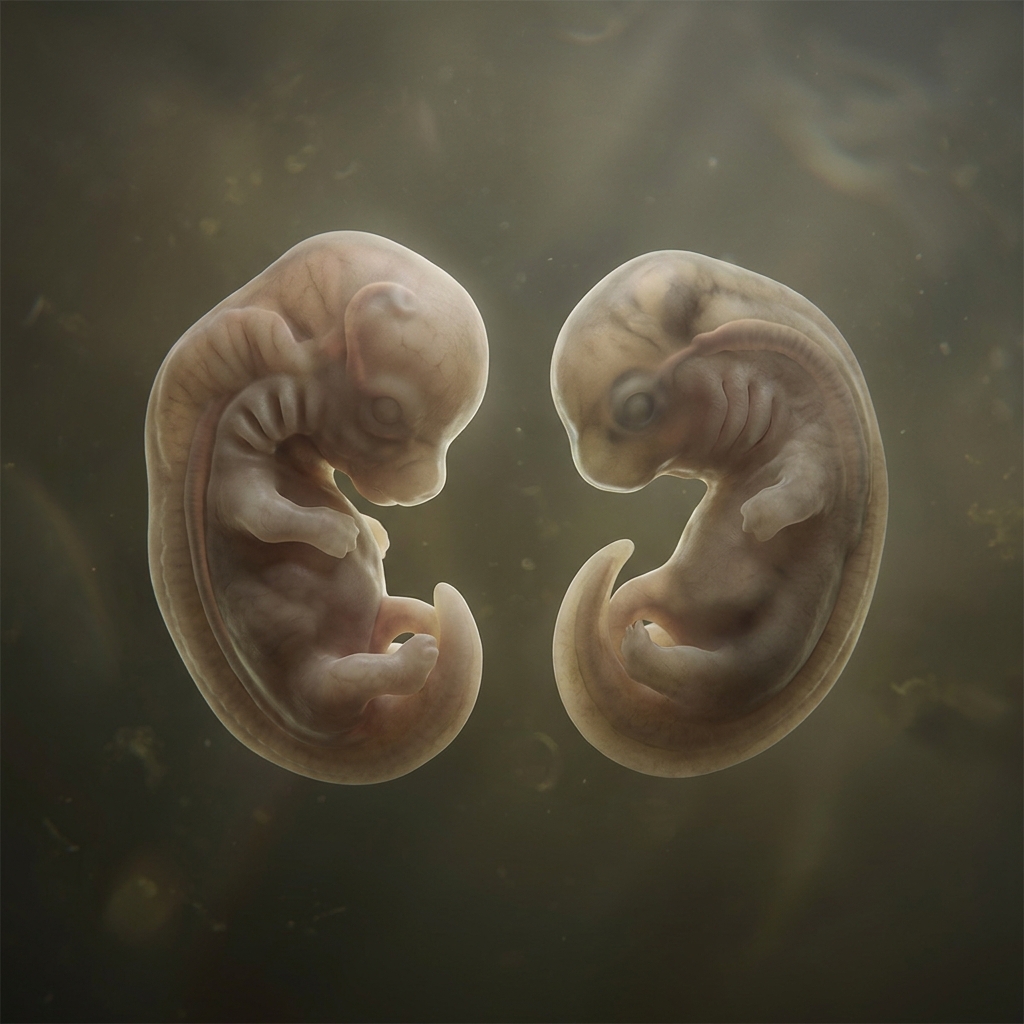
Hidden Connections: Embryos and Evolution, Developmental patterns in embryos and their relationship to evolutionary biology
Natural Selection and Trait Frequency, How natural selection changes the frequency of traits within populations
How Your Senses Send Messages to Your Brain, Biological processes behind how sensory organs transmit data to brains