

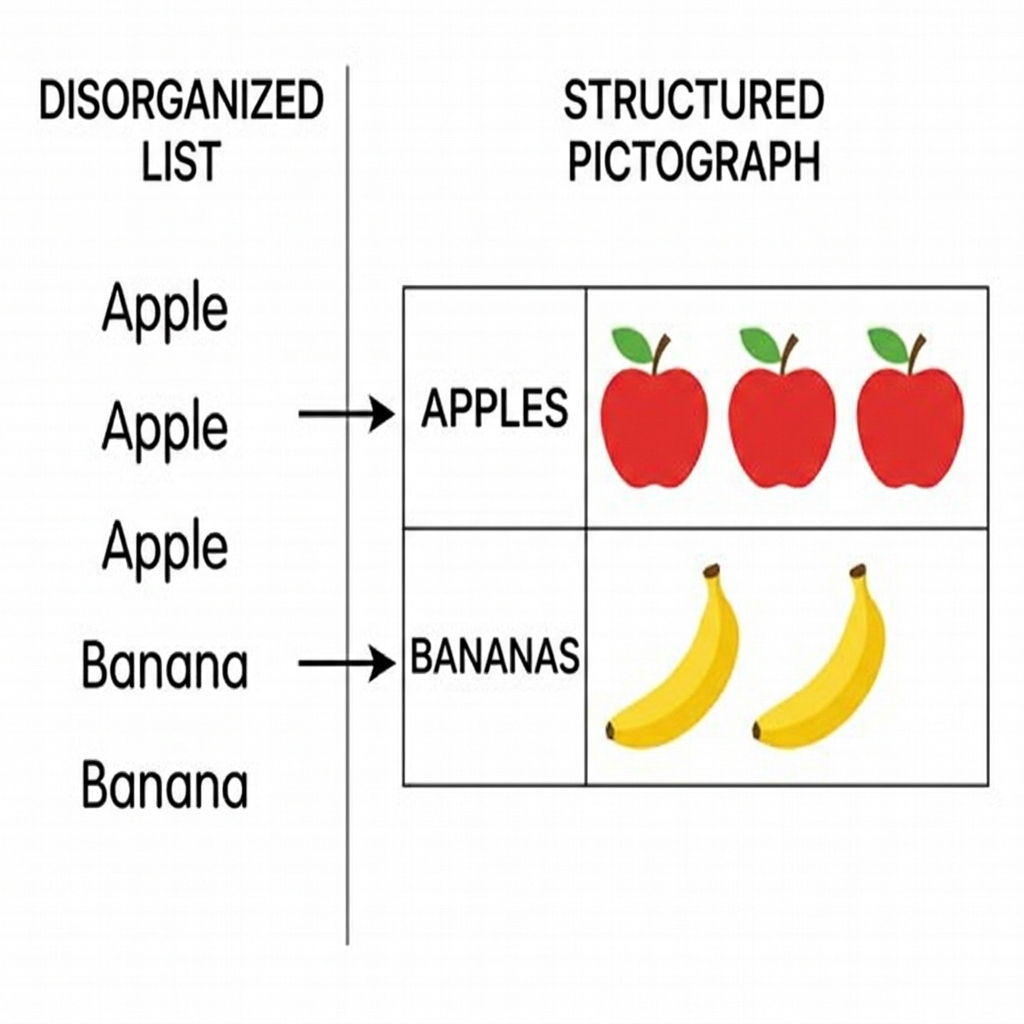
Students most often trip over the difference between the label of a category and the count of the items themselves. When you see a student staring at a bar graph, they are usually looking for the number right there on the paper rather than tracing the bar down to the axis or counting the squares to determine the quantity. This 2nd grade mathematics lesson helps clear up that confusion by walking students through the concrete process of turning raw counts into visual data. In this 2nd grade mathematics unit, the focus remains on building a bridge between counting objects and understanding what those counts tell us about the world.
You can find the resources in this Making and Reading Graphs lesson plan. It is built to fit into about 45 minutes of instructional time, making it a solid choice for a whole-class introduction, a refresher for a student who missed the week, or an independent study module. The lesson starts by grounding the students in the idea that they already know how to count objects in a group. It introduces the definition of data as information or facts that we collect and count. When students organize these facts, they begin to see the story behind the numbers, whether it is the fruit the class likes best or the toys a store manager needs to restock.
What the lesson actually asks students to do
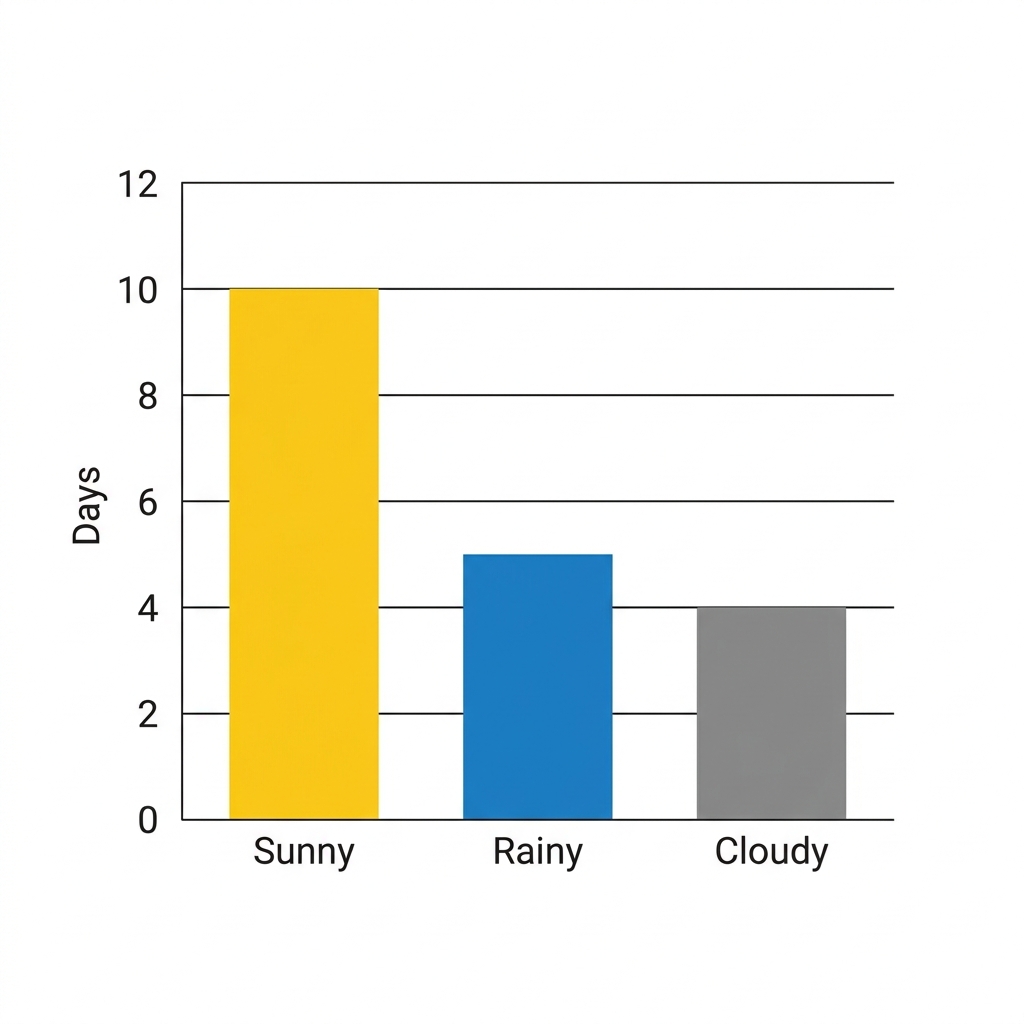
The lesson moves through a logical progression. First, students look at a scenario involving favorite classroom pets. The class discusses counts of three hamsters, four fish, two turtles, and one bird. Instead of just listing these numbers, the students use a collection of small pictures to represent each animal. This visual organization is the start of a picture graph. By using small pictures to show how many items are in each group, students learn that a graph acts as a shorthand for a table or a list. Once they grasp this, they move to the bar graph, which uses solid bars to show the same groupings. The terminology is introduced carefully: a picture graph uses small pictures to show how many items are in each group, while a bar graph uses bars to show the same information. You should check that students can identify these two forms before moving on to the analysis part of the lesson. For your search needs, you might look for a second grade graph lesson that breaks down these concepts into manageable pieces for young learners. The guided practice moves the students into a more independent space where they tackle a tally chart of lunch items. There are seven students who like pizza, four who like tacos, three who like salad, and five who like sandwiches. The task here is not just to draw the graph, but to use that graph to solve simple comparison problems. The lesson asks students to determine which lunch is the most popular and which is the least, which is the core of the standard requirements.
Where students slip
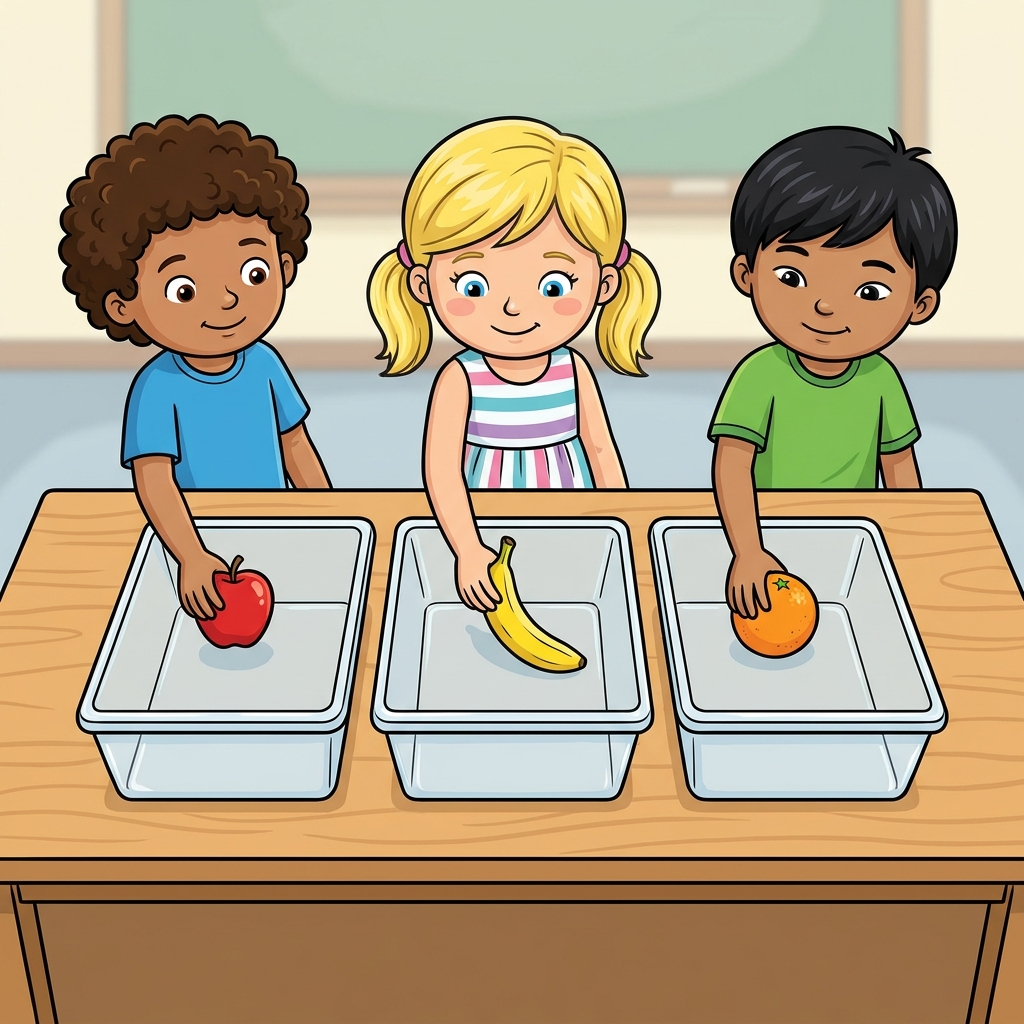
The standard CA.MATH.2.MD.10 asks students to draw a picture graph and a bar graph with a single-unit scale to represent a data set with up to four categories. It also requires them to solve put-together, take-apart, and compare problems using that data. This is the California-adopted standard, and it is taught consistently across districts like the Ontario-Montclair School District, Lodi Unified, Magnolia Elementary School District, and Imperial Unified. The main challenge for students is the scale. Even with a single-unit scale, where one square or one picture represents exactly one item, students will often miscount the squares if their lines are not straight or if they try to skip-count too early. Watch them as they move from the tally chart of lunches to the bar graph. Many will try to rush the coloring or the drawing of the bars, leading to inaccurate representations that make the later comparison questions impossible to answer correctly. Remind them that the graph is a tool for communication. If the bar is too long or too short, the person reading the graph will not know the truth about the pizza or the taco count. It is a good idea to emphasize that data is information we collect and count, and the accuracy of our collection determines the quality of our analysis. This lesson works well for a day when you need to pull a small group for intervention, as the structure is predictable enough that the rest of the class can complete the graphing tasks with minimal teacher support. You can use it as a substitute day plan as well, provided the class has had some exposure to tally marks already. The final step of comparing the bars, such as asking how many more students chose pizza than salad, is where the real thinking happens. Keep the conversation focused on what the bars represent in the real world, like the store manager deciding which toys to order. This keeps the math from feeling like a dry exercise in coloring boxes.
Related lessons
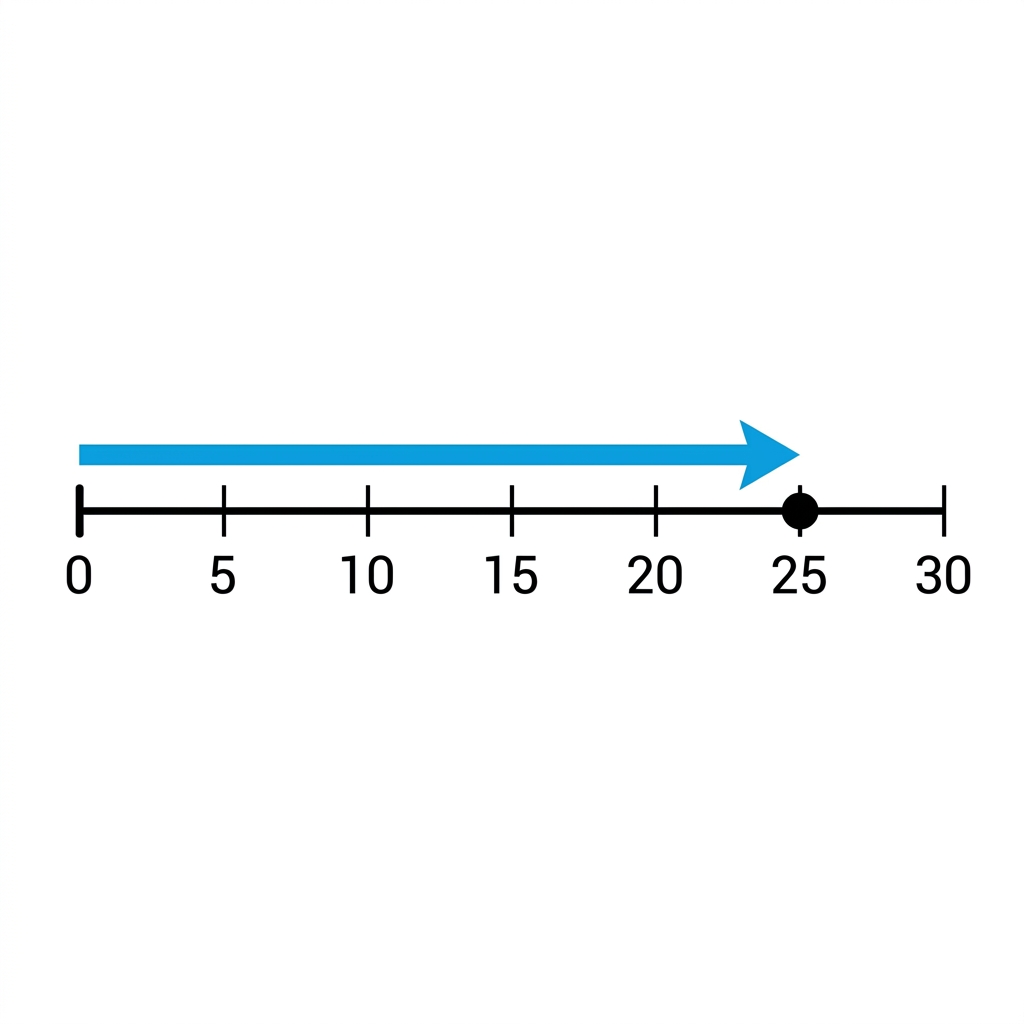
Number Lines and Lengths, Representing whole numbers and length measurements on number lines
Learning About Money, Identifying coin values and calculating small sums of money
Measuring and Solving Length Problems, Measuring objects and using tools to solve addition problems