

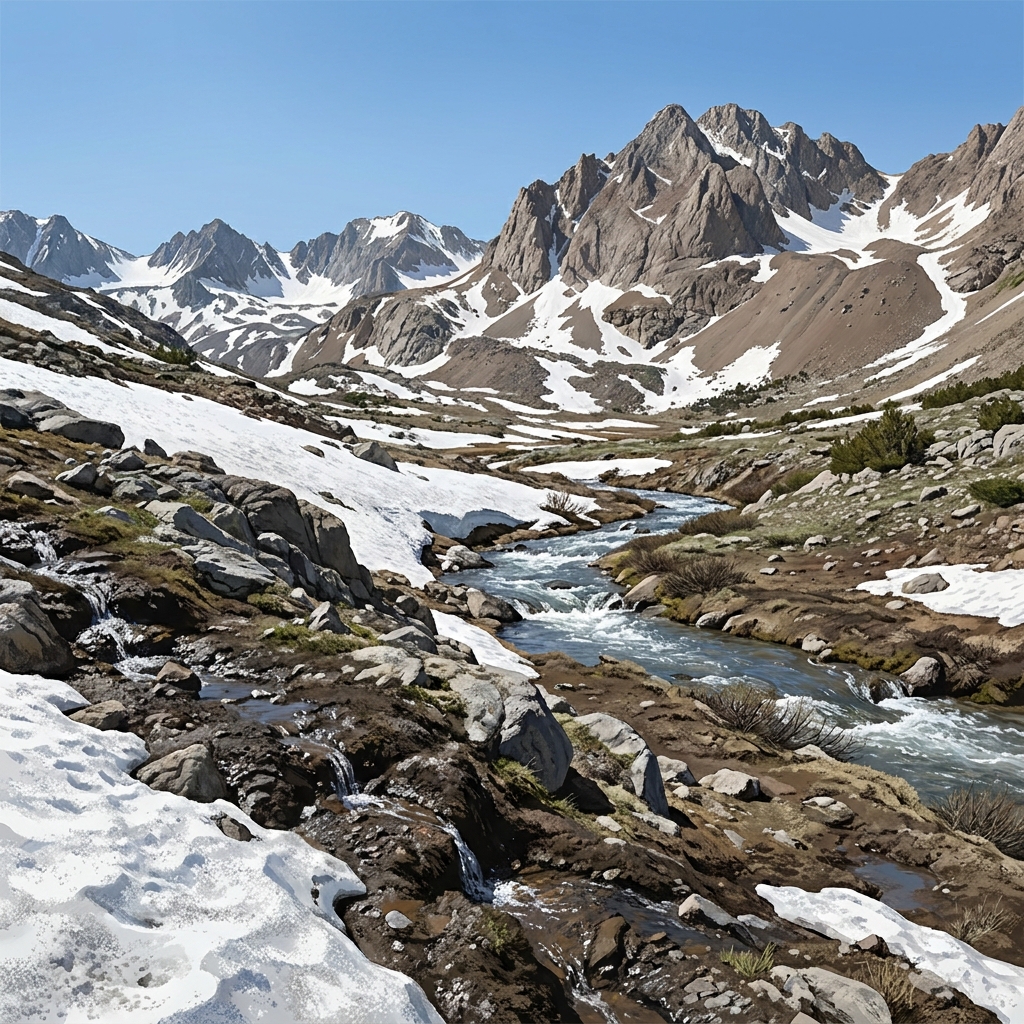
I know we often feel like we are just scratching the surface when it comes to climate science. We have limited time and a massive amount of data to cover. When you are planning for your high school science students, you want them to stop guessing and start calculating. The lesson Forecasting California’s Climate Future actually gives them a tool to do that. It is designed to take the vague concept of climate change and ground it in the reality of our state’s water, agriculture, and mountain ranges.
This is a solid resource for your biology or earth and space science courses. It moves beyond generic definitions and forces a deep engagement with how computer models work. The lesson covers the core concept of climate forecasting using data-driven models. It introduces two vital vocabulary terms: Climate Model, which is a computer-based representation of Earth’s systems used to simulate how climate might change in the future, and Snow-Water Equivalent, which is the amount of liquid water stored in snowpack, used to measure how much water will be available when snow melts.
Understanding the expectations of CA.HS-ESS3-5
When you look at the standard CA.HS-ESS3-5, it sounds like a heavy lift because it asks students to analyze geoscience data and the results from global climate models to make an evidence-based forecast of the current rate of global or regional climate change and associated future impacts to Earth systems. Notice how the standard is broken down. It requires students to handle data sets, interpret outputs from predictive models, and then build a defensible argument about what those numbers mean for our systems. In California, this standard specifically adds the need to use state climate assessment data to forecast regional impacts like sea level rise along the coast, reduced snowpack, increased wildfire risk, and the effects on agriculture and water supply. Whether your students are at Sacramento City Unified, San Diego Unified, Glendora Unified, or Summerville Union High School District, they are working toward this same standard, which asks for a synthesis of quantitative data and real-world system awareness.
Applying data to the Sierra Nevada
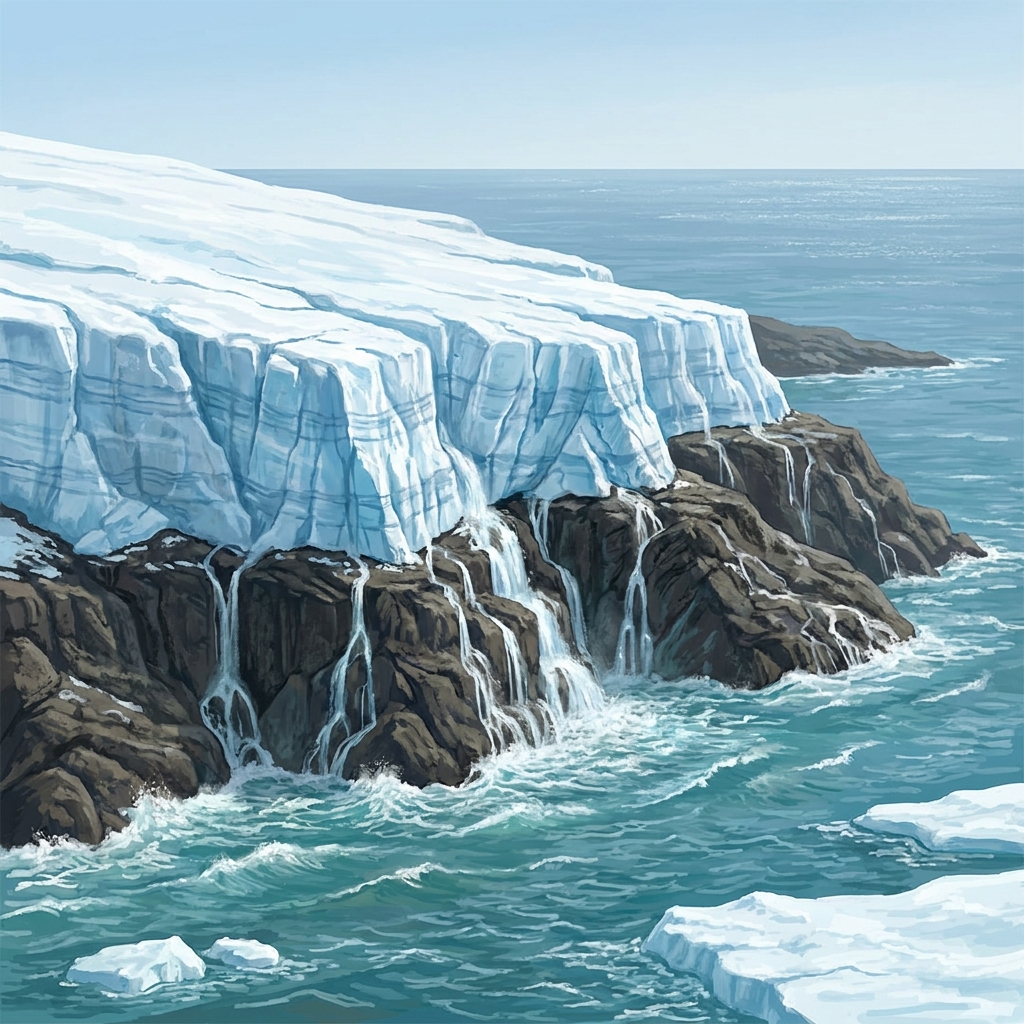
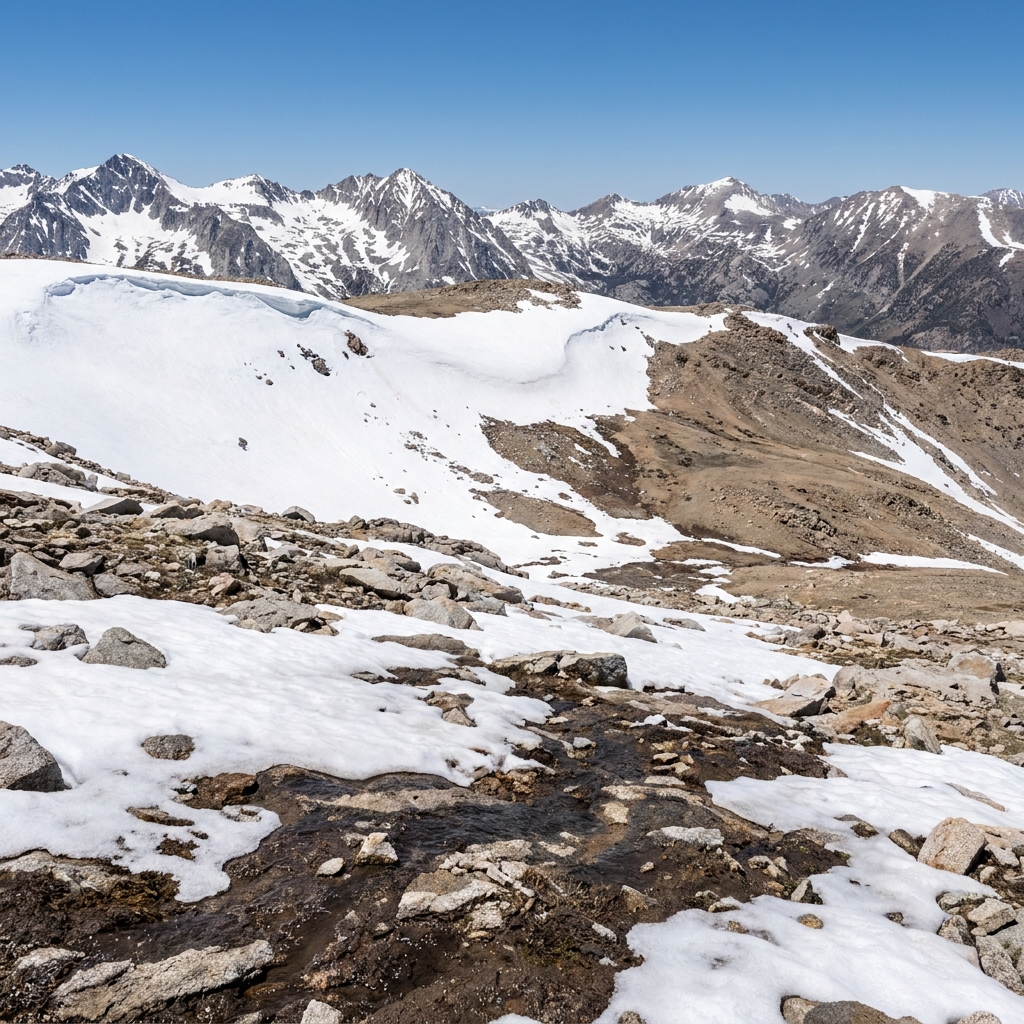
I appreciate how this lesson handles the nuance of the mountain systems. Students start by learning that scientists track Earth’s health by monitoring long-term trends in temperature. They then use a worked example involving the Sierra Nevada. High-emissions climate models show a significant reduction in snowpack because rising temperatures cause more precipitation to fall as rain rather than snow. This makes the math tangible. It is not just about a warmer globe; it is about the physics of water storage. Seeing the direct connection between rising heat and changes in our natural systems is a lightbulb moment for many students who have lived through recent drought cycles.
Analyzing complex systems in the Central Valley
For your high school climate science lesson, the guided practice is where the real thinking happens. You take your class through a simulation of crop yields in the Central Valley. The activity focuses on seasonal water synchrony, which is the timing of water availability matching crop needs. It pushes students to think like farmers or water resource managers. They have to decide if water-intensive crops can survive if snowpack melts earlier in the year than historically observed. It is a fantastic way to show that science matters because the decisions we make about water and forests today affect the world we live in tomorrow. By using climate models, we can design smarter cities and better infrastructure.
Where this fits in your teaching cycle
This lesson is designed to take about 45 minutes, which makes it perfect for a few different scenarios. If you have students who missed a full week of lab work, this gives them a concise way to catch up on the analytical side of the unit. It also functions well as an independent study module for a student who is working ahead or needs extra practice with interpreting graphs and models. If you have an unexpected absence, this is a clean, ready-to-go plan for a substitute who needs something content-heavy but accessible for high schoolers.
My one caveat is that you should be prepared to support students who struggle with reading line graphs or scatter plots, as the models can look a bit dense at first glance. Once they see how the axes correlate to actual water levels, they generally take off on their own. It is a productive way to turn that abstract standard into something they can actually manipulate and interpret.
Related lessons
California's Natural Environment and Human Life, Studies the intersection of state ecosystems and human development patterns
Mitigating Human Impact on California Systems, Covers strategies for reducing human influence on local natural systems
Earth and Life: A Two-Way Street, Explains how biological life and geological systems influence each other