


When we look at Understanding Data Distributions, we see a lesson that asks students to be capable of “giving quantitative measures of center (median and/or mean) and variability (interquartile range and/or mean absolute deviation), as well as describing any overall pattern and any striking deviations from the overall pattern with reference to the context in which the data were gathered.” That is a long way of saying that students cannot just crunch numbers anymore. They have to explain what those numbers mean in a real-world setting. This is the California-adopted CA.MATH.6.SP.5c, which expects 6th grade students to move beyond calculation and into the analytical territory of statistics.
You will find this same standard taught across the state in districts such as Mt. Diablo Unified, Torrance Unified, Lamont Elementary School District, and Santa Cruz City High School District. The objective is to use measures of center and variability to justify patterns and unusual values. It is a necessary shift because math is rarely about the result alone. The process of arriving at that result is where the logic happens.
What students do in this lesson
The lesson starts with an opener that grounds the math in something students recognize: sports statistics. Using a basketball player as an example, the material introduces the mean as a measure of center that gives an average number of points scored. From there, it defines the necessary vocabulary for the day. You will cover Mean, which is the average value found by adding all numbers in a set and dividing by the count of numbers, and Median, the middle value in an ordered list. It also introduces the Interquartile Range, defined as the distance between the first and third quartiles, representing the spread of the middle half of the data, and Mean Absolute Deviation, which is the average distance of each data point from the mean.
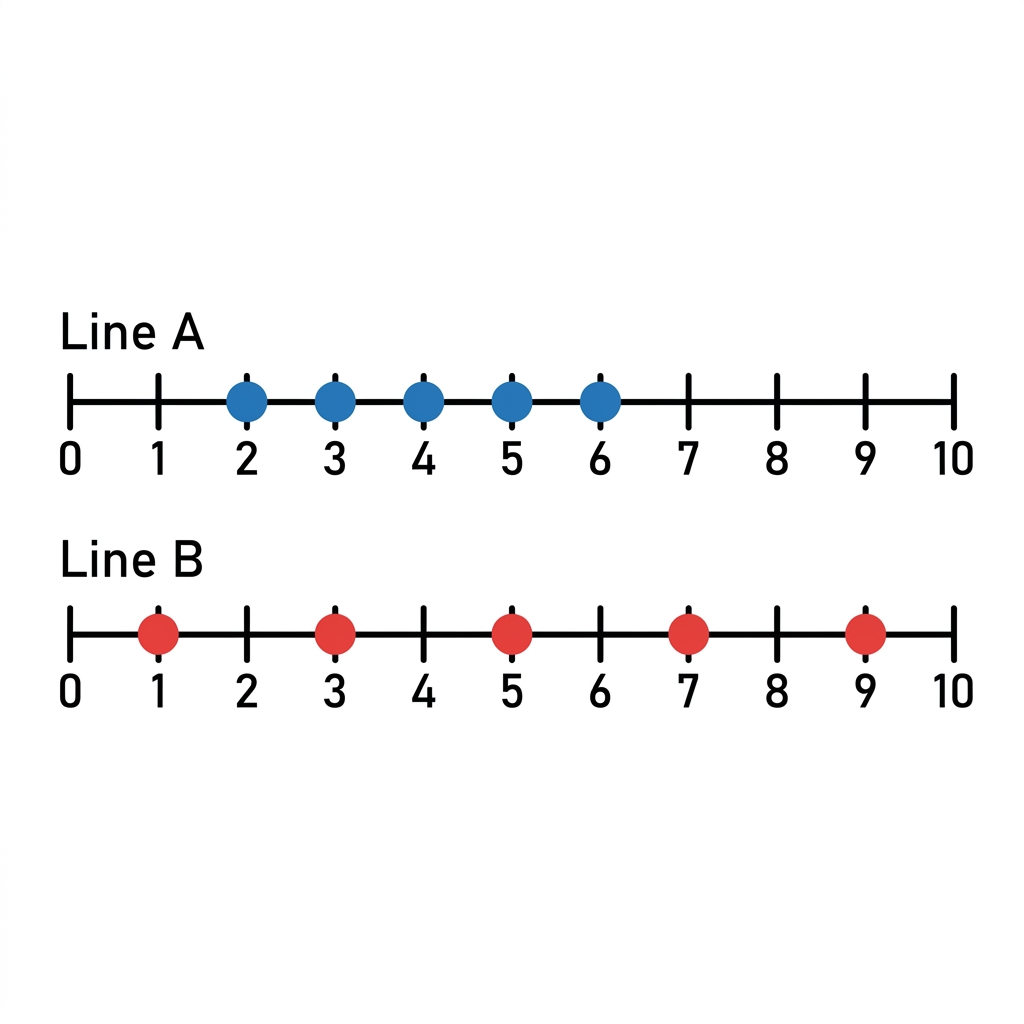
Once the definitions are set, the lesson moves to a concrete example about plant growth. When looking at heights of 2, 3, 3, 4, and 10 inches, the lesson points out that 2, 3, 3, and 4 form a cluster near the center, while 10 is an outlier. This is a perfect example to show students that data often tells a story. The plant growth pattern is generally consistent, but that 10 is an unusual value that needs to be acknowledged and discussed. It forces the class to look at the numbers and think about what might have caused that height to be so different from the rest.
For guided practice, your students work through a scenario about park visitor counts. They use the provided data to identify patterns in how many people visit the space over a week. This allows them to apply their knowledge of center and variability to a real-life situation. The lesson includes a section on why this matters, using the example of a store owner scheduling employees. If a store knows the average number of customers, they can make informed staffing decisions. It helps them understand that a mean of 15 customers means that if the flow were perfectly even every day, they would serve exactly 15 people daily. You can use this material for a whole-class assignment, to help a student who missed the week, or even for an independent study session.
Where students slip in their analysis
The trickiest part of this 6th grade data distribution practice is the jump from finding a number to describing a pattern. Students are often good at finding the mean or the median when the numbers are right in front of them. However, they struggle to describe what that number tells them about the distribution. When they see a set of data, their eyes go straight to the calculation. They want to be done with the arithmetic.
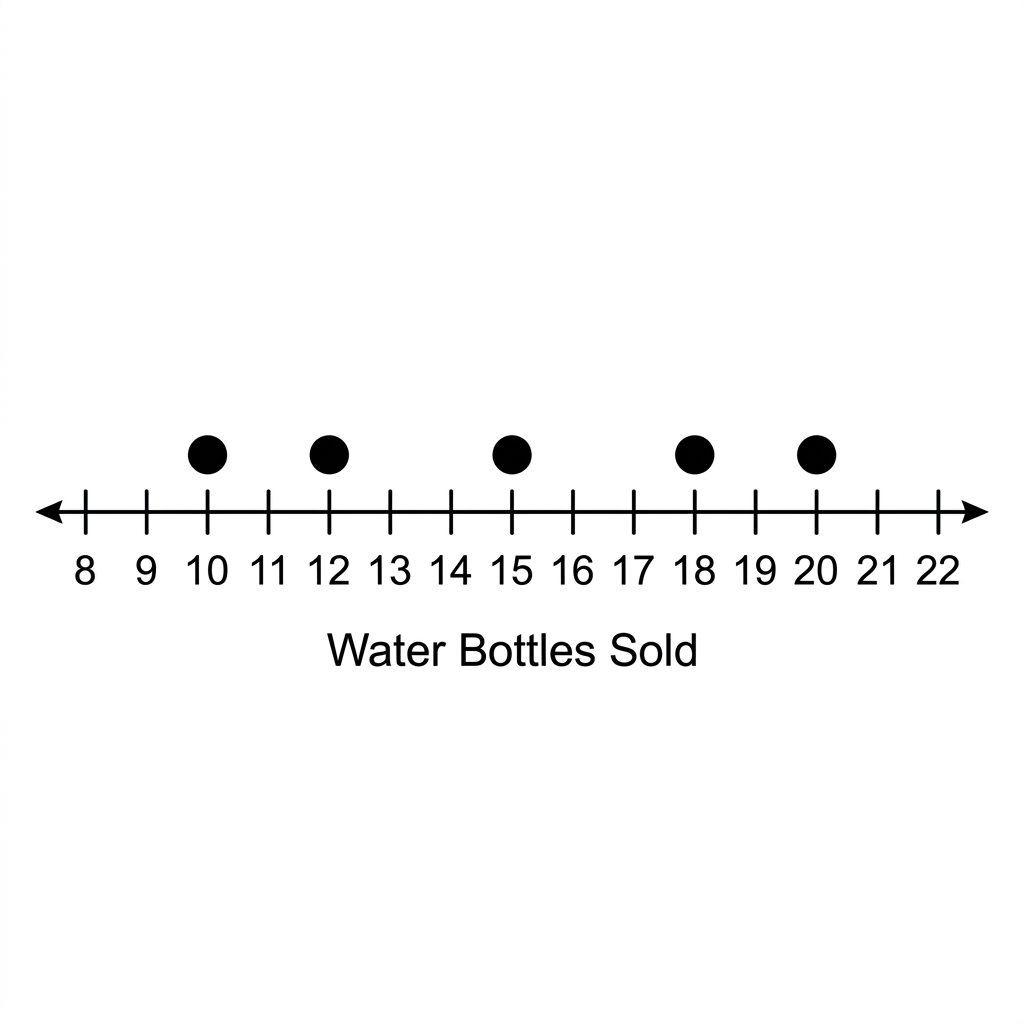
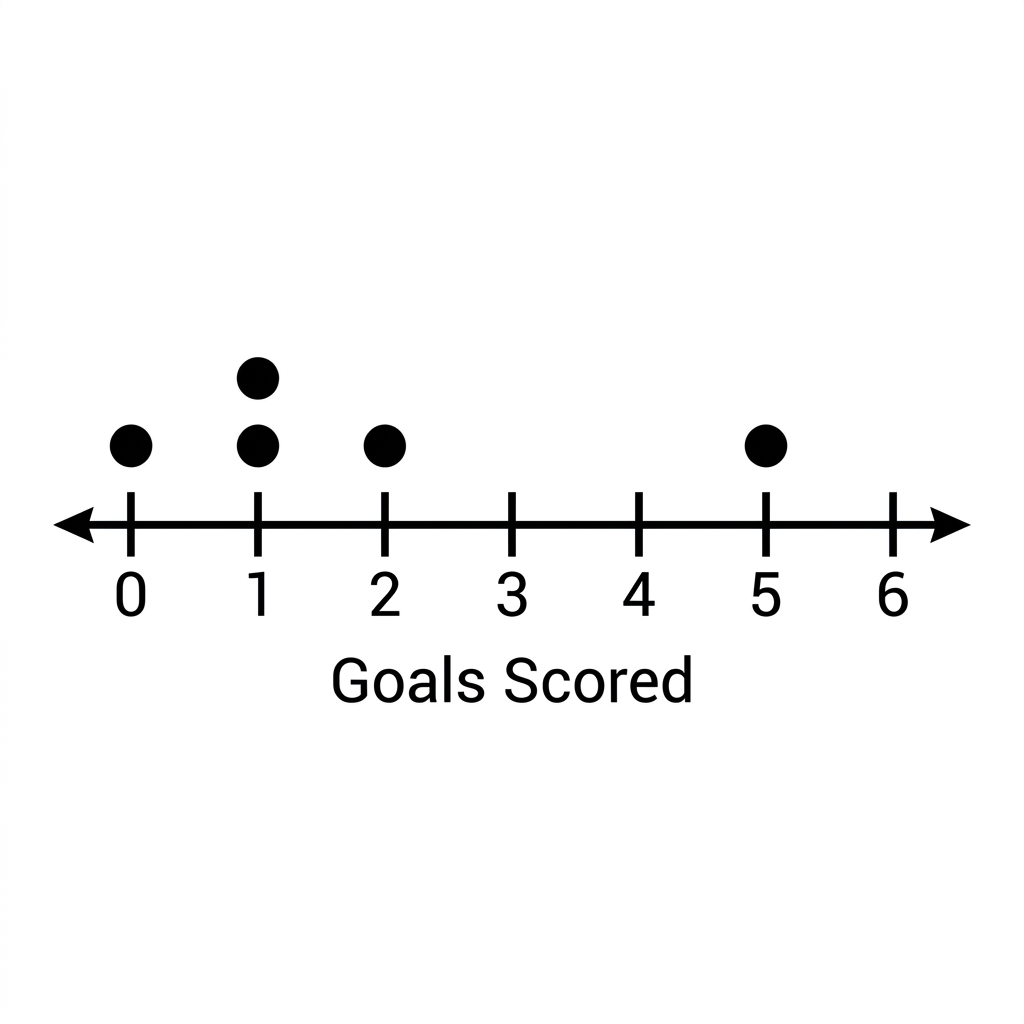
As a teacher, you have to push them to articulate the context. When they calculate a mean absolute deviation, ask them what that distance says about the consistency of the data. If the deviation is small, the data points are huddled together. If it is large, the points are spread far from the center. You will see that students often ignore the context of the data entirely. They treat the numbers as abstract symbols on a page rather than real values. In the park visitor example, challenge them to explain why a specific day might have been lower or higher than the mean. Did the weather play a role? Was it a weekend? Using the context to explain the data is what makes this standard stick. If you have a student who is struggling with the calculation, have them draw the data on a number line first. Seeing the distribution visually helps them realize when a value is truly an outlier and when it is just part of the normal spread.
Related lessons
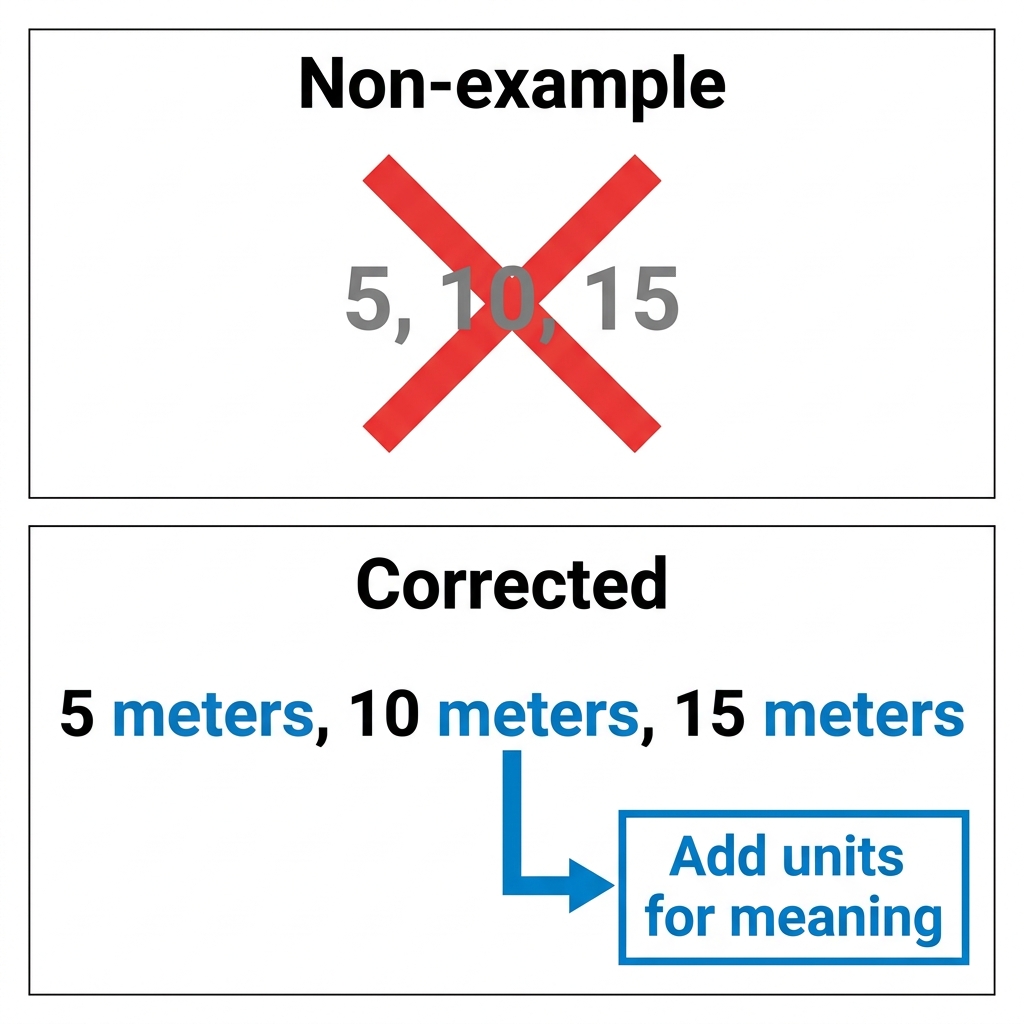
Understanding Data Sets, Students learn to analyze and describe various numerical data sets
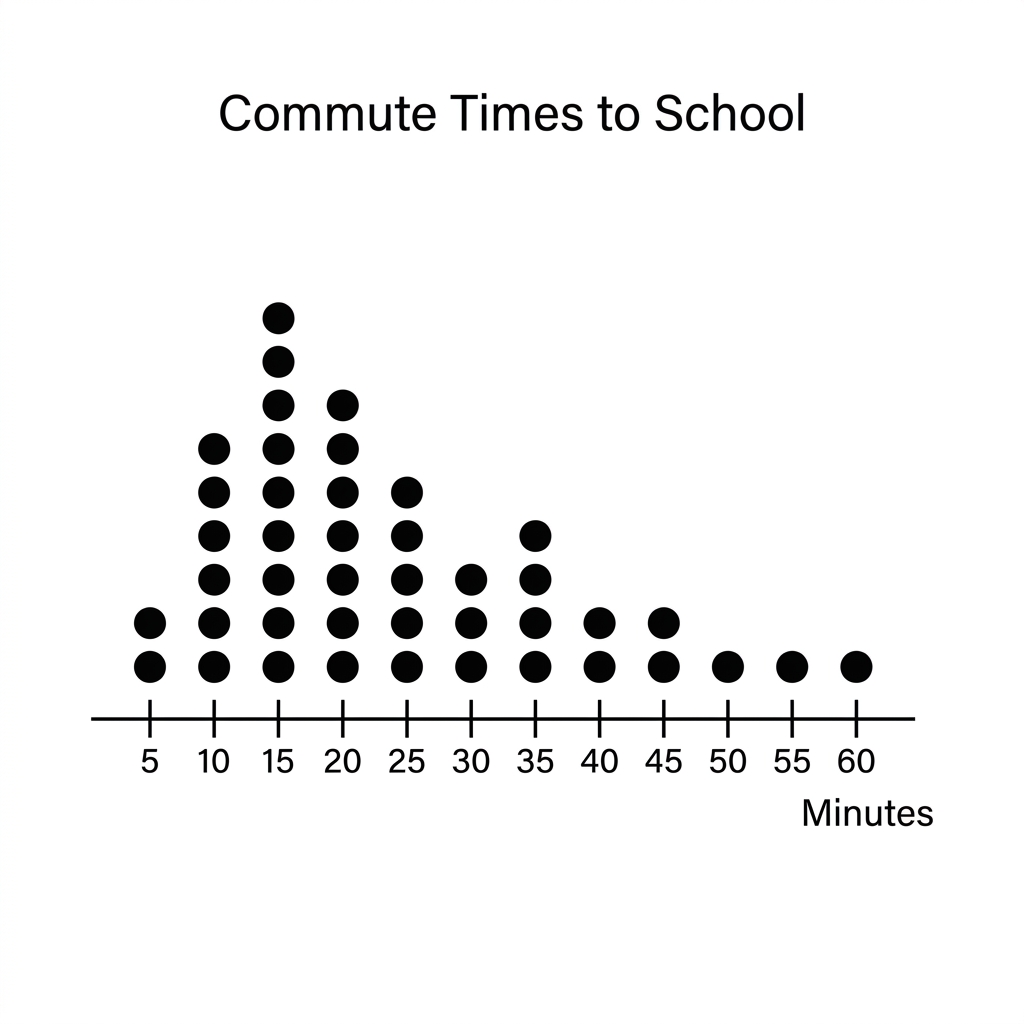
Understanding Statistical Questions, Defining and identifying questions that require data collection and analysis
Understanding Data Distributions, Using center and variability measures to describe data distribution patterns