

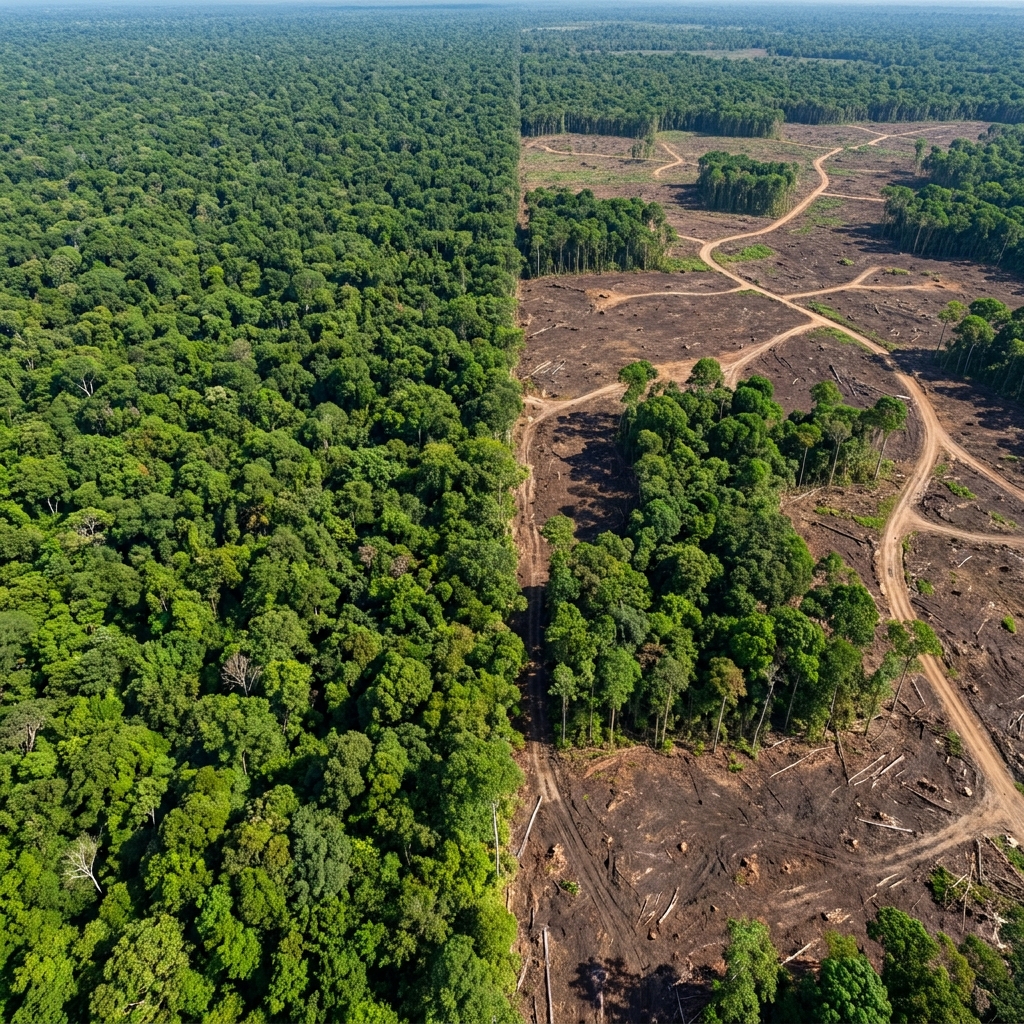
A colleague once asked me how to respond when a mother wondered why we spend so much time on charts and satellite photos in an English class. It is a fair question. In 6th grade English Language Arts, we are often pressured to stick strictly to novels and essays. Yet, the reality of modern literacy is that our students are flooded with information that exists outside the bounds of a traditional paragraph. The lesson Understanding Media and Its Impact offers a concrete way to bridge that gap. It gives students the tools to decode the world around them, whether that involves looking at a weather report or analyzing a graph about environmental changes.
The lesson focuses on the central idea that we often use different tools to learn about the world, and understanding how these tools work is a vital ability for any student. The objective is to have students interpret different types of media to explain how they add meaning to a topic. By the end of the 45-minute block, your students will have categorized various information sources. They learn that quantitative data is information that is measured or counted, often shown in charts or graphs. They also look at visual media, which refers to images, photographs, or diagrams that show information instead of just using words, and oral presentation, which covers information shared through spoken language, such as a speech, interview, or news report.
What the lesson actually asks students to do
This 6th grade media interpretation lesson starts with a prior-knowledge opener that uses a melting glacier as a powerful example of environmental change. It explains that observing the physical state of the ice helps us understand the impact of climate change in a way that words alone cannot. This is a brilliant way to frame the conversation because it immediately moves the students away from the idea that a text is only something you read. From there, the lesson moves to a worked example involving satellite imagery of a forest before and after trees are cut down to demonstrate the scale of deforestation. It is a high-impact visual that forces a reaction, making it easier for students to connect with the concept of evidence.
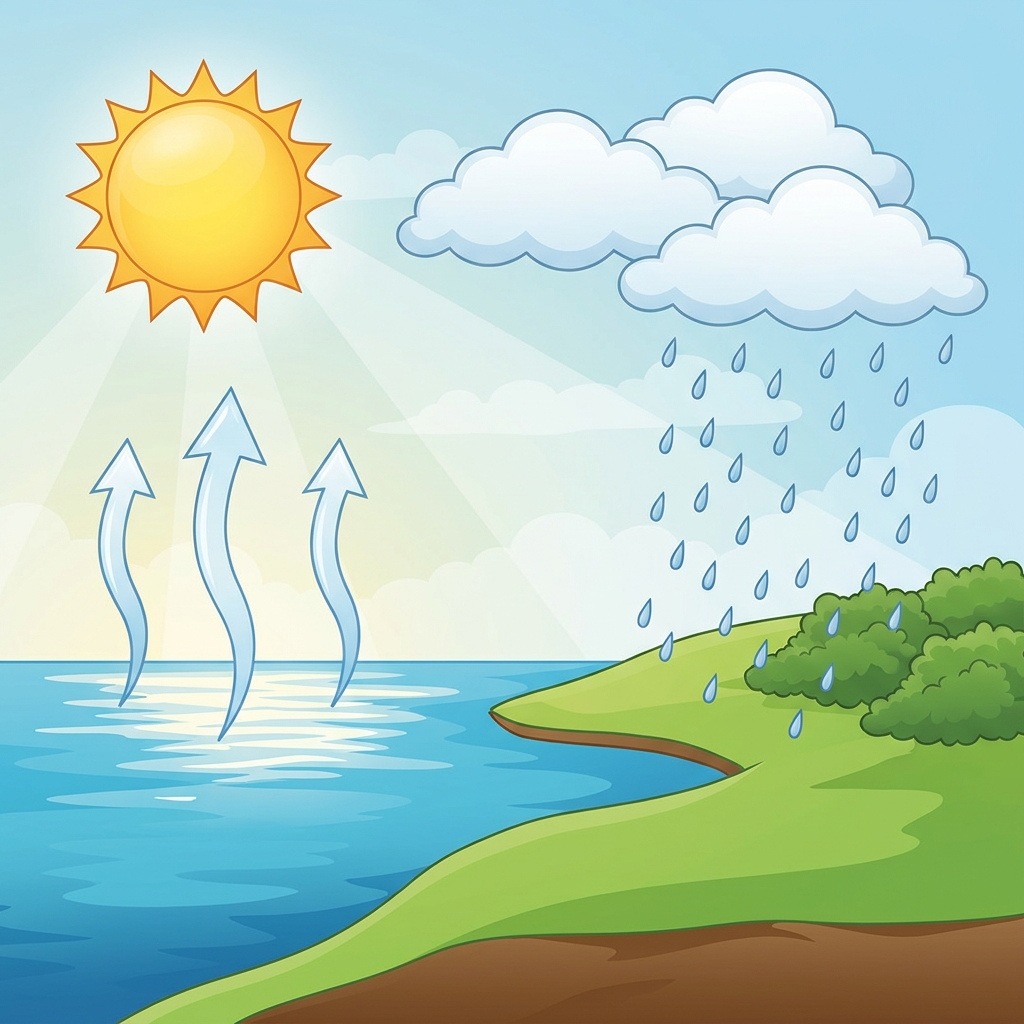
The guided practice moves into a passage about air quality. Students analyze an air quality index that tells us how safe the air is to breathe. You will find that some students latch onto the colors used in these indices, while others want to jump straight to the numerical values. Encourage them to see how both the visual color-coding and the quantitative measurement work together to explain a single issue. This exercise is excellent for a whole-class assignment, or for a student who missed the week and needs to catch up on literacy standards that require interpreting information outside of prose.
Addressing the standards in the classroom
The lesson is built around the California standard CA.ELA.SL.6.2, which asks students to interpret information presented in diverse media and formats and explain how it contributes to a topic, text, or issue under study. The California-adopted version of this standard includes an emphasis on explaining how that media contributes to the topic itself. This aligns with CCSS.ELA-LITERACY.SL.6.2, which requires the same interpretation of diverse media and formats. Teachers in Clovis Unified, Escondido Union School District, Eureka City Schools School District, and Saint Helena Unified are all working toward the same expectations, as these standards are the baseline for every classroom across our state. When you teach this, you are teaching students to be critical consumers of information, a skill that is just as important as reading a novel for plot.
Where students slip
The biggest hurdle I see with 6th graders is the assumption that visual or quantitative media is simpler than reading a text. Many students treat graphs and photos as decorations rather than sources of evidence. If you see a student struggling during the air quality section, ask them what specific part of the graph led them to their conclusion. Do not let them say it looks bad or it looks high. Push them to use the vocabulary from the lesson. Ask them to point to the quantitative data that shows the air quality is poor. You might also find students who struggle to synthesize oral information if you play a short clip or read a news report aloud. Have them write down one fact they heard and one fact they saw in the accompanying visual. This forces them to bridge the gap between their listening skills and their visual analysis.

I recommend using this for independent study or as a backup plan for a substitute day. It is self-contained enough that students do not need a massive library of books to succeed, yet it requires enough cognitive work that they will stay focused. It reminds them that when they watch the news, look at a weather app, or read a report for school, they are using these skills to understand the world around them. It is a quiet, productive way to get them thinking like researchers instead of just consumers.
Related lessons
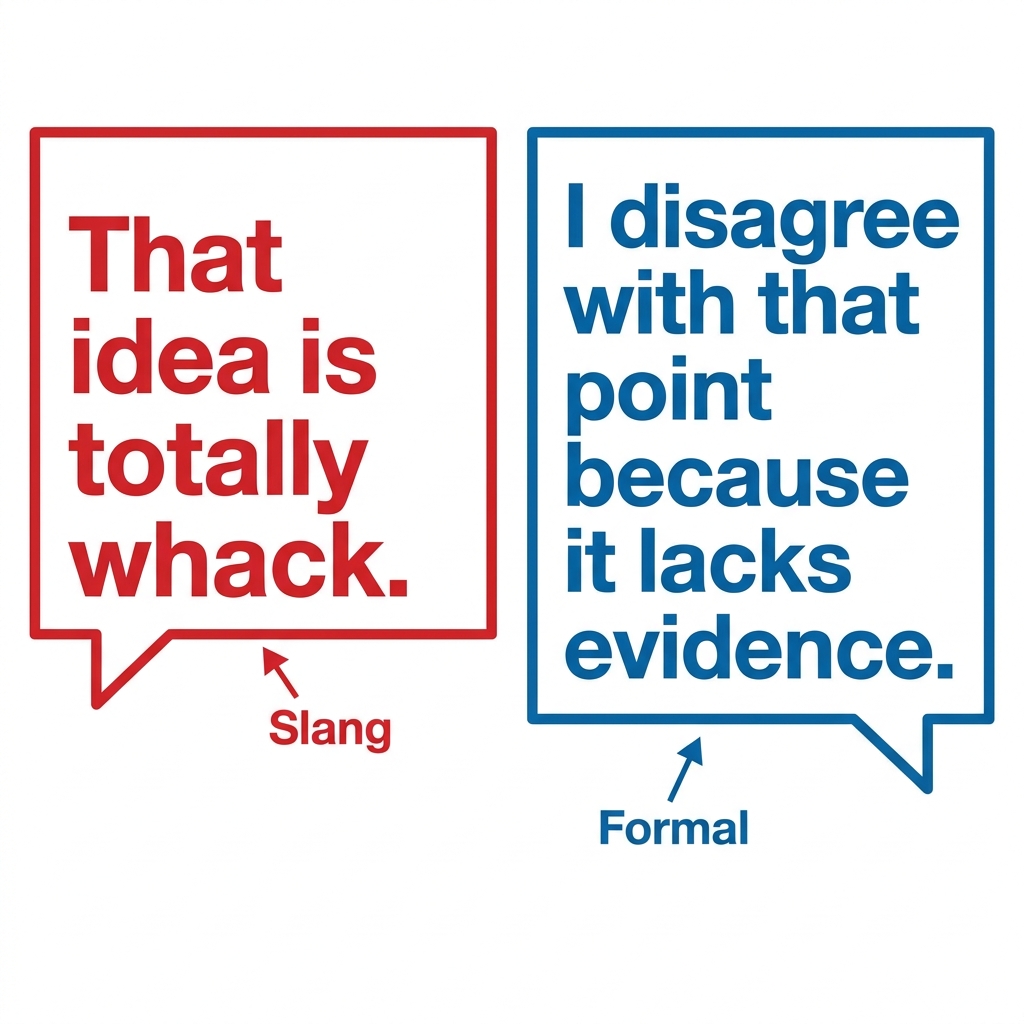
Speaking with Style and Purpose, Focuses on delivery techniques and clarity in spoken communications
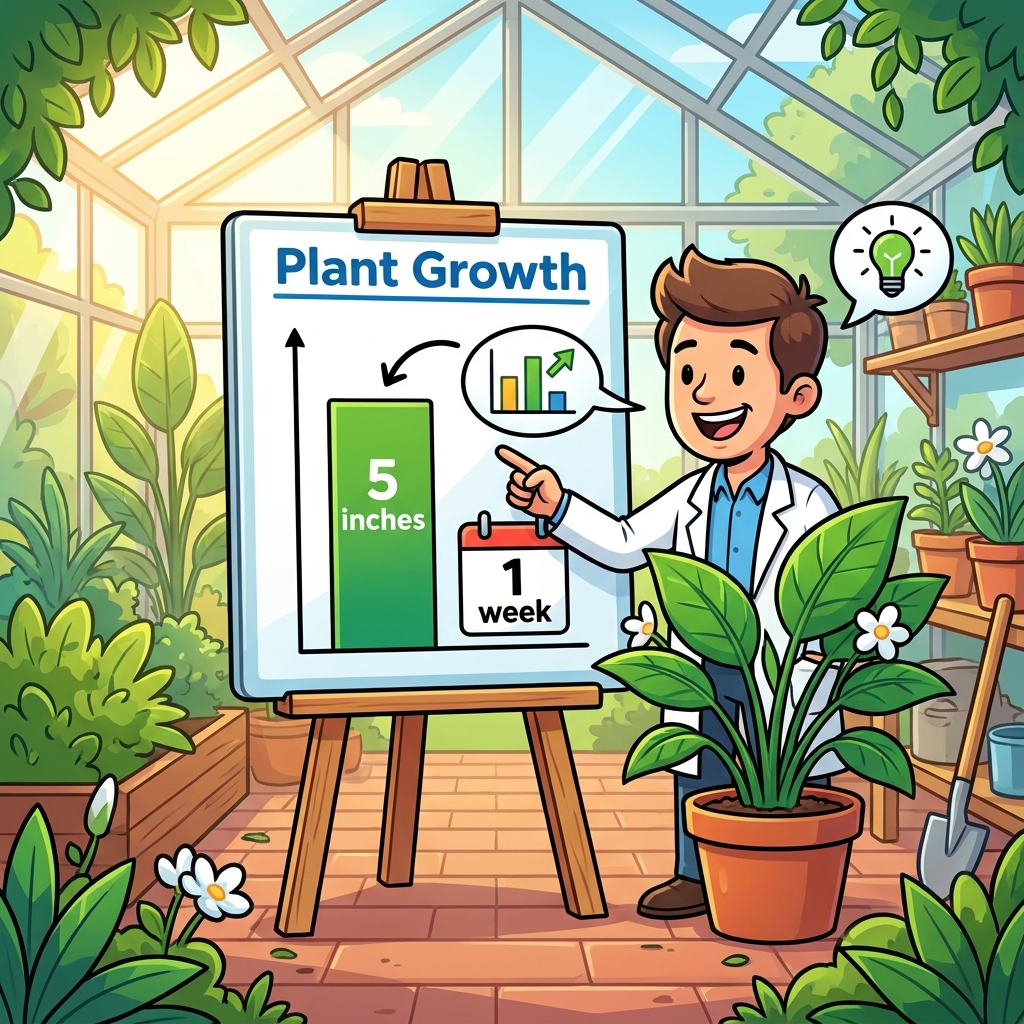
Evaluating Arguments and Claims, Teaches students to analyze logic and evidence within claims
Building Better Discussions, Provides strategies for productive group conversation and academic discourse