

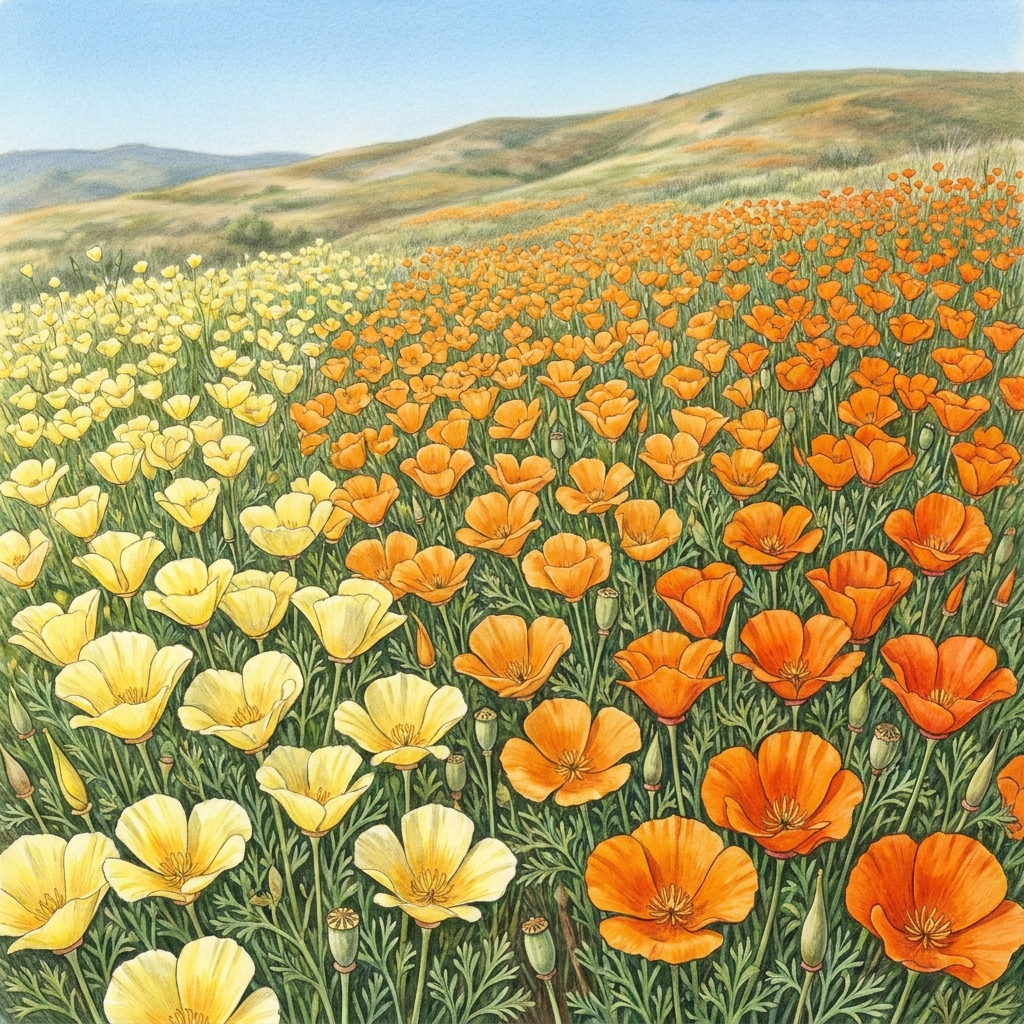
My students frequently hit a wall when we start talking about population genetics. They see an average height or a median color and decide that is the only data point that counts. They want to ignore the edges of the bell curve as if those individuals are errors or typos in the dataset. It is a common mistake because students are so conditioned to look for the right answer, the single correct number, rather than seeing a distribution as a meaningful reality.
When you sit down with Biodiversity and Trait Variation in California, you get a clean way to break that habit. This high school science lesson in the Biology course forces students to look at the messiness of real populations. It treats the outlier not as a mistake but as an essential part of the species survival toolkit. Whether you are using this as a whole-class assignment or for a student who missed the week, it provides a concrete framework for looking at how biological traits actually manifest.
What the lesson actually asks students to do
The core objective is for students to use data and statistics to explain why different traits are common or rare in a population. It starts with the familiar: counting physical characteristics within the classroom. This is where you introduce the vocabulary. A phenotype is the set of observable physical characteristics of an organism, such as height, eye color, or leaf shape. A population is a group of individuals of the same species living in a specific geographic area. An outlier is a data point that differs significantly from the rest of the observations in a set.
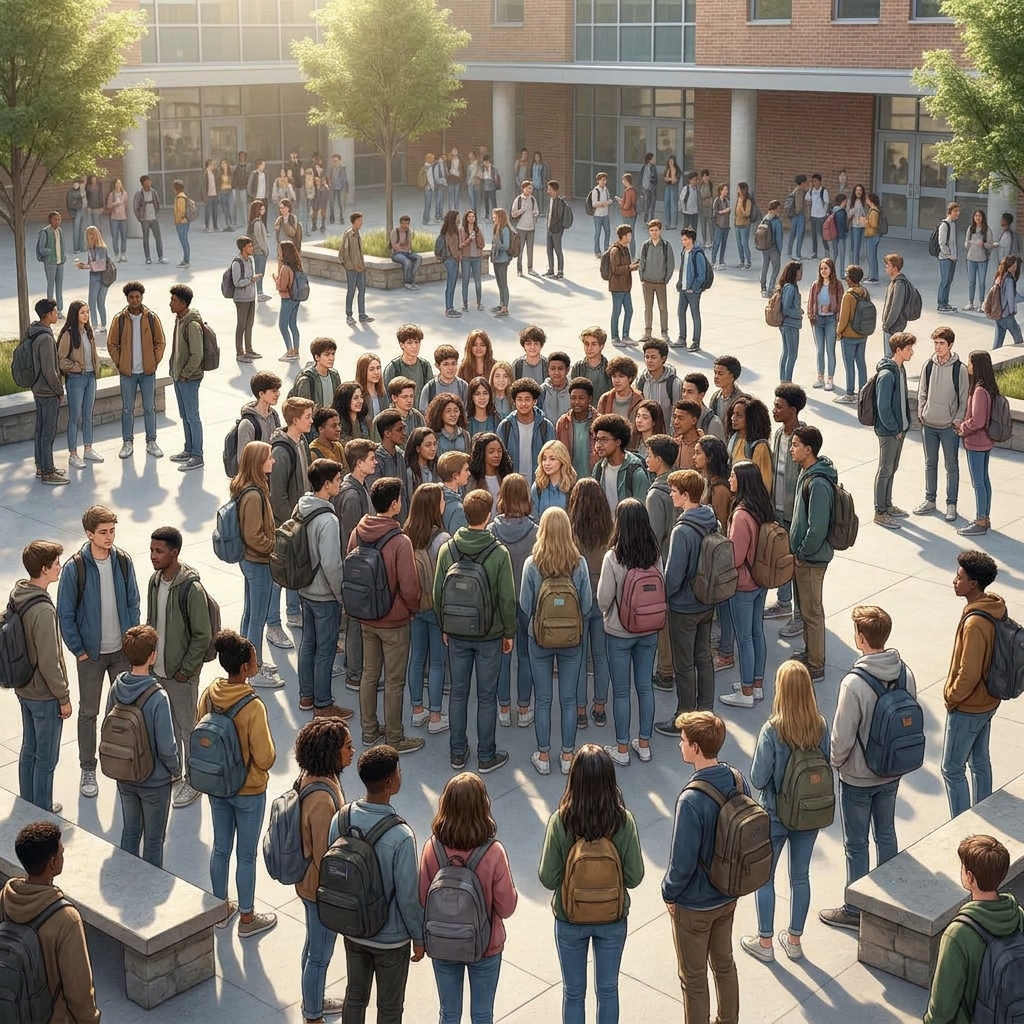
The lesson moves from the classroom to the field with a clear scenario involving California poppies. These plants show a range of colors from light yellow to deep orange. The lesson notes that “because the medium-orange color is the most frequent, the distribution of these petal colors follows a normal distribution pattern.” Students then have to apply this concept of normal distribution to coastal grasses. This part of the material is excellent because it connects the math directly to a real-world pressure: rising sea levels and increased salt water in the soil. It makes the abstract math of high school biology trait variation feel grounded.
Where students slip
The trap is thinking the average tells the whole story. Students will often calculate the mean and feel finished. They forget that the spread of the data is where the story of adaptation lives. If a population of coastal grass only has one shade of green, it has no resilience when the environment shifts. Teachers in the East Side Union High School District, William S. Hart Union High School District, Lemoore Union High School District, and Temple City Unified all use the same standards to help students see this connection. The lesson forces them to confront that variation isn’t just noise. It is the biological insurance policy that allows a species to survive if the environment changes, such as during those increasingly hot California summers.
Practical application for your classroom
This is a standard-aligned activity based on CA.HS-LS3-3. This California-adopted standard asks students to apply concepts of statistics and probability to explain the variation and distribution of expressed traits in a population. It is part of the broader work in the California NGSS Framework, which contextualizes high school science with specific phenomena like biodiversity hotspots and the state’s unique climate zones. You can rely on this as a solid substitute day activity or as a dedicated intervention session for those who missed the introduction to heredity and population dynamics. The time commitment is about 45 minutes, which is exactly how long you need to get them past the surface-level math and into the actual science of why phenotypes matter. Keep the focus on why the outliers might be the ones to survive if conditions move toward their extreme, and you will see the lightbulbs start to turn on.
Related lessons
Energy Flow and Matter Cycling in California Ecosystems, How energy and matter move through various California biological systems
Energy Transformation in California's Ecosystems, Principles of energy conversion within specific California ecological environments
Homeostasis: The Body's Balance, Mechanisms for maintaining stable internal conditions in living organisms